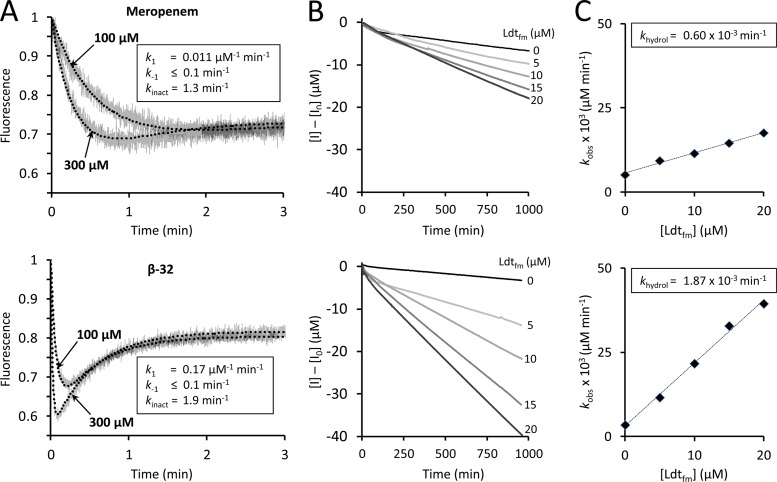
Fig 2.
Determination of kinetic constants of Ldtfm. (A) The kinetic constants k1, k−1, and kinact were determined by spectrofluorimetry, as previously described (16). Ldtfm (10 μM) was incubated with meropenem or carbapenem β-32 (100 and 300 μM) in sodium phosphate buffer (100 mM; pH 6.0) and fluorescence was recorded at 10°C on a Cary Eclipse spectrofluorimeter (Varian SA) equipped with a stopped-flow apparatus (RX-2000; Applied Photophysics). Trp residues were excited at 225 nm with a slit of 5 nm and an optical path length of 2 mm. Fluorescence emission was determined at 335 nm with a slit of 5 nm and an optical path length of 10 mm (gray lines). The detector voltage was set to 600 V. Fluorescence was normalized to the fluorescence intensity of free Ldtfm, which was the lone form of the enzyme at the onset of the reaction. Kinetic constants were determined by fitting simulations (dotted lines) to experimental data (gray lines), as previously described (16). Fitting was simultaneously performed with four drug concentrations (30, 100, 300, and 1,000 μM; results for only two concentrations are shown for clarity). (B) The kinetic constant khydrol was determined spectrophotometrically. Carbapenems (100 μM) were incubated with Ldtfm (0, 5, 10, 15, and 20 μM) in sodium phosphate buffer (100 mM; pH 6.0), and absorbance at 299 nm was recorded at 20°C on a Cary 100-Bio spectrophotometer (Varian SA). Alkaline hydrolysis of the β-lactam ring of meropenem and of β-32 led to similar decreases in the molar extinction coefficient (Δε = −7,200 and −7,400 M−1 cm−1, respectively). The velocity of the reaction (kobs) increased with Ldtfm concentration, indicating that the enzyme catalyzed carbapenem hydrolysis in addition to spontaneous drug hydrolysis. (C) Hydrolysis velocity (kobs) was plotted as a function of Ldtfm concentration, and enzyme turnover (khydrol) was deduced from the slope.

