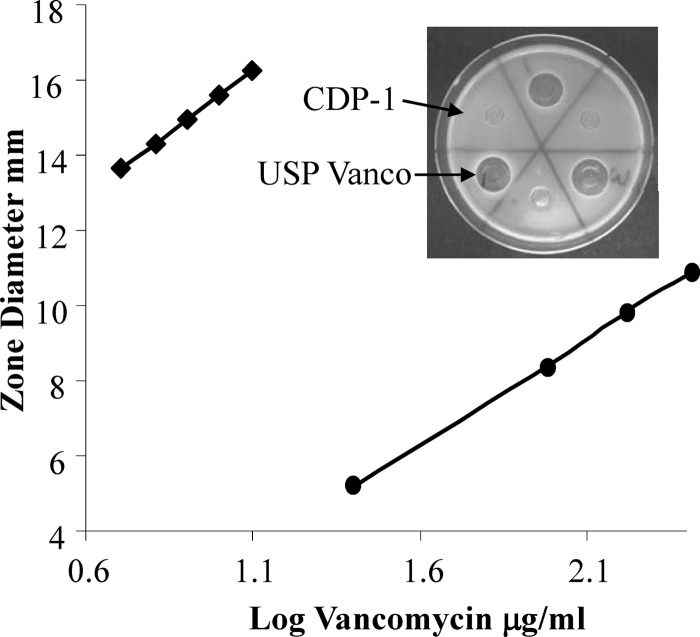
Fig 4.
Antimicrobial activity comparison of USP vancomycin HCl (diamonds) and CDP-1 (circles). USP vancomycin (5 to 12.5 μg/ml) and CDP-1 (25 to 250 μg/ml) were compared using a USP cylinder plate zone-of-inhibition assay according to the USP method. After a 24-h incubation at 37°C, the kill zone diameters were measured from scanned images of each plate using Image J software. USP vancomycin and CDP-1 activities were described by the lines y = 6.77x + 8.83 (R2 = 0.99) and y = 5.84x − 3.25 (R2 = 0.99), respectively. The inset shows a representative plate comparing 10-μg/ml amounts of CDP-1 and USP vancomycin.

