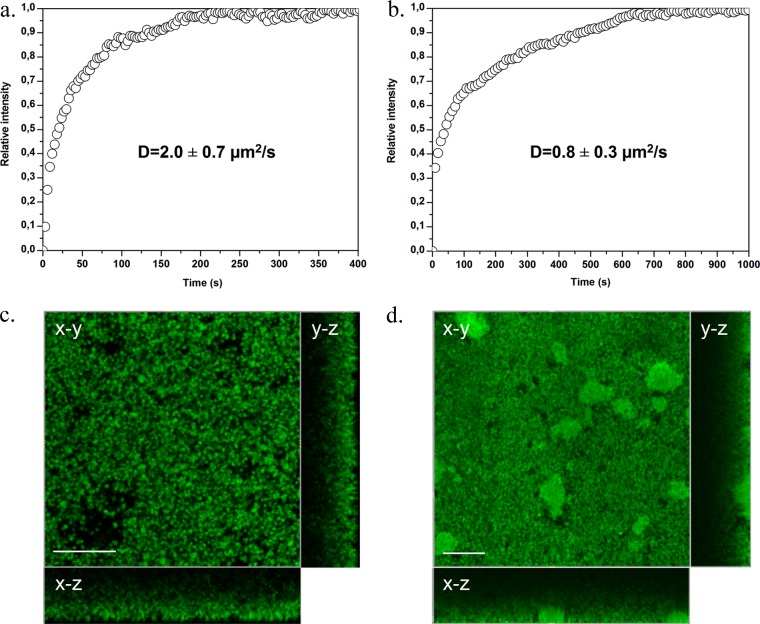
Fig 4.
Time course of BODIPY-vancomycin penetration measured at the bottom of S. aureus ATCC 6538 (a) and ATCC 27217 (b) biofilms. The relative intensities correspond to a normalization of the maximum intensity value to 1. (c and d) Corresponding fluorescence intensity images taken at the bottom of the biofilms (in an x-y plane) showing BODIPY-vancomycin penetration in the whole structure of biofilms at 400 s (c) and 1,000 s (d), when the antibiotic equilibrium is reached. The images are sectioned along two vertical and orthogonal x-z and y-z planes: the substratum-biofilm interface is the outside part of the rectangle, and the biofilm-medium interface is the one close to the square fluorescence intensity image. Scale bar, 20 μm.

