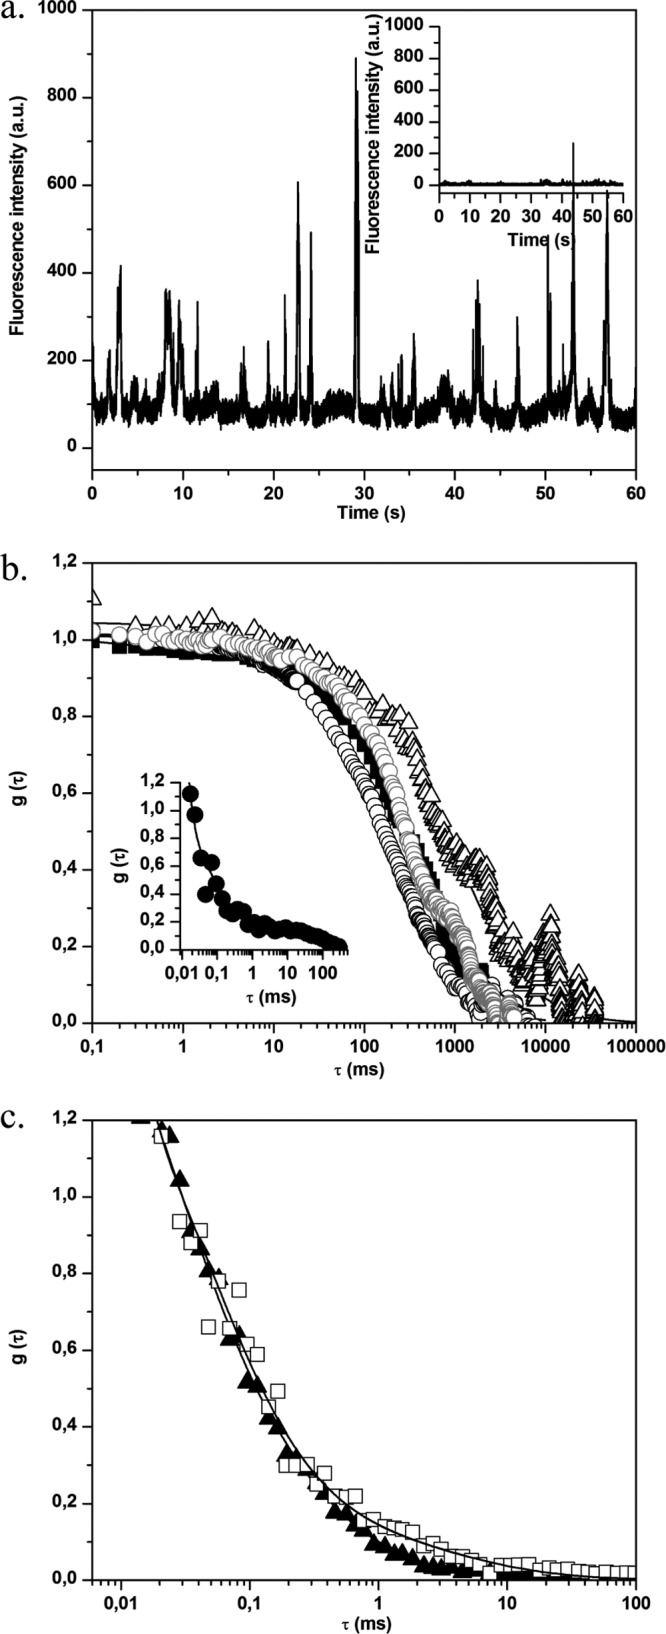
Fig 6.

(a) Fluorescence time traces for S. aureus biofilm without (inset) and with BODIPY-vancomycin. In the presence of labeled vancomycin, the fluorescence intensity of biofilm cells increases, which corresponds to the motion of fluorescently cell aggregates in the excitation volume. (b) Normalized fluorescence autocorrelation curves g(τ) for BODIPY-vancomycin interaction with S. aureus cells inside biofilm. The measurements were obtained in different zones: ∼3 μm (△), ∼10 μm (■), and ∼25 μm (○) from the biofilm-coverslip interface. The fit of the curves (straight lines) was obtained using equation 2. The gray curve corresponds to the motion of S. aureus biofilm without BODIPY-vancomycin. (Inset) g(τ) for BODIPY diffusion inside S. aureus biofilm. (c) Fluorescence autocorrelation curves g(τ) for BODIPY-vancomycin diffusion with P. aeruginosa biofilm. The acquisitions were performed inside (□, zone 1) and outside (▲, zone 2) the mushroom structure of the biofilm (the zones are defined in Fig. S1c in the supplemental material). The fit of the curves (straight lines) was obtained using equation 2.
