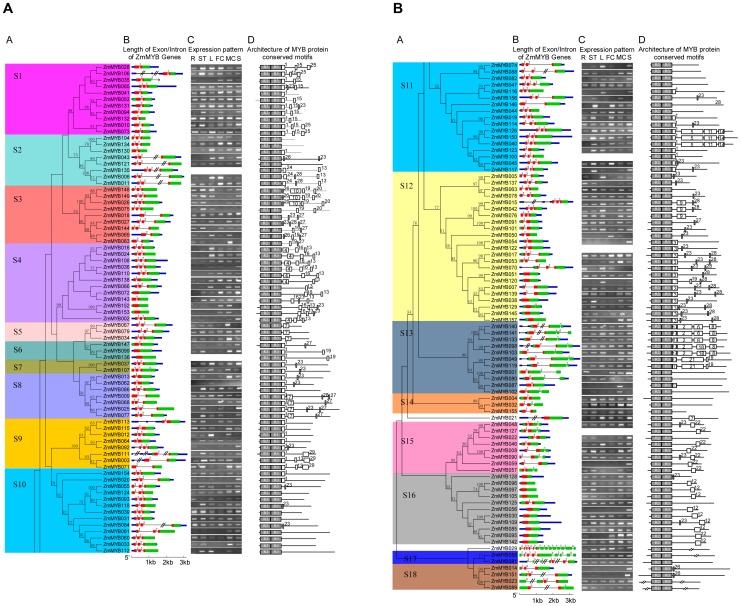
Figure 2. Phylogenetic relationships, intron pattern, expression pattern, architecture of conserved protein motifs, and subgroup designations in typical R2R3-MYB proteins from maize (Zm).
A, The neighbor-joining (NJ) tree on the left includes 157 typical R2R3-MYB proteins from maize. The tree shows the 18 phylogenetic subgroups (S1–S18) marked with colored backgrounds, to facilitate subfamily identification with high predictive value. The numbers beside the branches represent bootstrap values (50%) based on 1000 replications. Eight proteins did not fit well into clusters. The colorful marker in the tree indicates the corresponding intron distribution patterns, as shown in Figure 3, below. B, The gene structure is presented by green exon (s), red MYB domain (s), blue UTR (s), and spaces between the colourful boxes corresponding to introns. The sizes of exons and introns can be estimated using the horizontal lines; the number indicated the phases of corresponding introns. C, The expression patterns of MYB genes in maize. The letter R above the column of expression data refers to root, ST refers to stem, L refers to leaf, FC refers to female catkins, MC refers to male catkins, and S refers to seed. D, Architecture of conserved protein motifs in 18 subfamilies. The motifs on the right were detected using MEME and are graphically represented as white boxes drawn to scale for a representative plant MYB protein of each subfamily.

