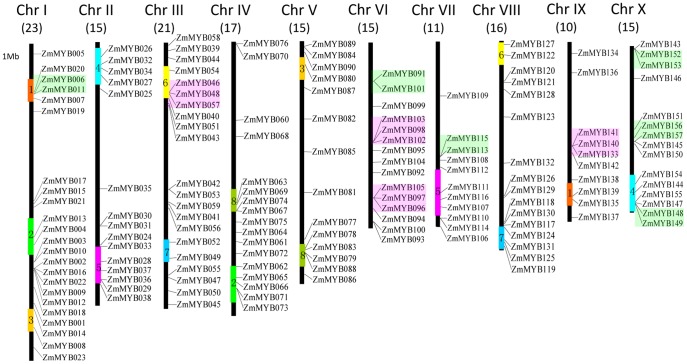
Figure 4. Chromosomal locations, region duplication, and predicted cluster for maize R2R3-MYB genes.
The chromosomal position of each ZmMYB was mapped according to the maize genome. The chromosome number is indicated at the top of each chromosome. The number below indicates the number of ZmMYBs in each chromosome. The scale is in mega bases (Mb). The colored boxes indicate groups of predicted gene cluster with paralogous and syntenic genes on the chromosomes. The colored bars with numbers on the chromosomes indicate the 8 predicted duplication regions.

