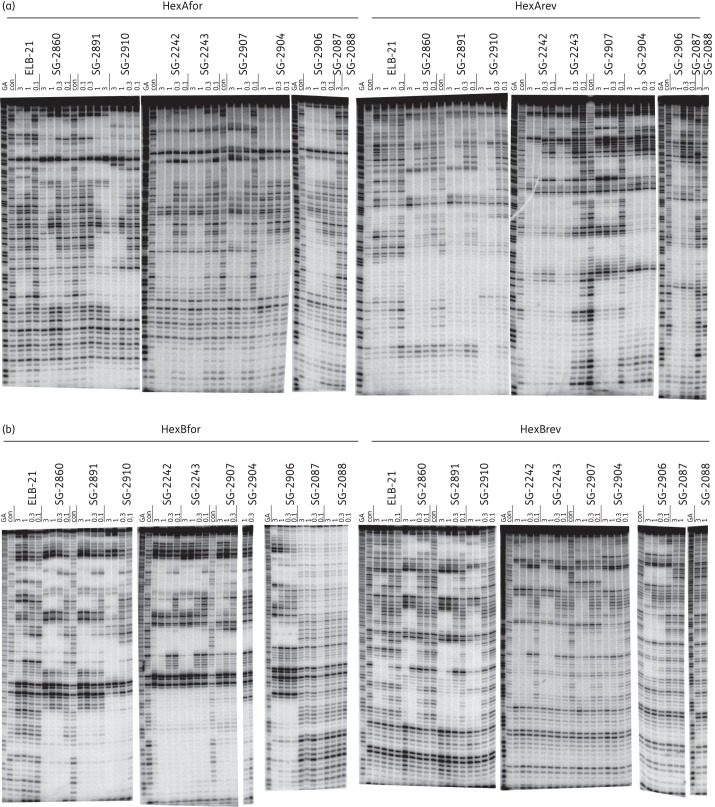
Figure 3.
DNase I footprints showing the interaction of the PBD dimers with HexA and HexB fragments. The sequences of these fragments are shown in Figure S1. Concentrations of the ligand (μM) are indicated at the top of each gel lane. Tracks labelled ‘con’ show DNase I cleavage in the absence of added ligand, while ‘GA’ tracks are markers specific for purines (G + A). (a) HexAfor and HexArev. (b) HexBfor and HexBrev. The DNA fragments were labelled at their 3′-ends with 32P.

