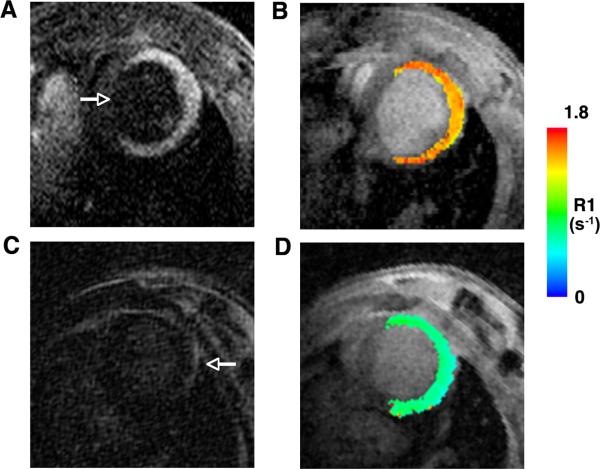
Figure 4.
Comparison of MR images in mice with acute myocardial infarcts injected with either Gd-TO (A, B) or Gd-DTPA (C, D). The mice shown were imaged 18–24 hours after infarction. Both mice showed severe wall motion abnormalities in their anterior, lateral and inferior walls, consistent with extensive infarcts. The arrow in panel (A) points to the uninjured septum. (A, B) Robust accumulation of Gd-TO is seen in the infarct 2–3 hours after injection, producing signal hyperintensity and high R1 values. (C) In contrast 2–3 hours after the injection of Gd-DTPA there is no sign of an increase in signal intensity in the infarct, which is nulled and isointense with the septum. The arrow in panel (C) points to the pericardial fat, which marks the outer border of the infarcted myocardium. (D) A R1 map of the mouse injected with Gd-DTPA shows no increase in R1. Thus Gd-TO is retained in acute myocardial infarcts, while GD-DTPA is not.

