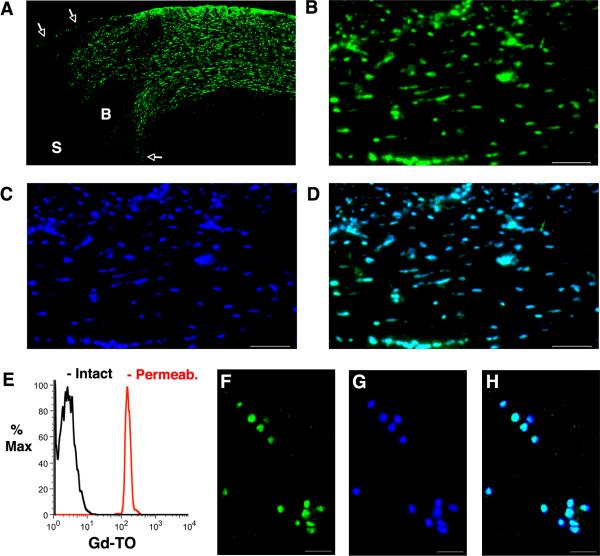
Figure 6.
Fluorescence microscopy of Gd-TO in a mouse imaged 18 hours after myocardial infarction. (A) Low magnification (4×) view of the infarct, border zone and uninjured septum. The white arrows mark the endocardial and epicardial borders of the myocardium. S = Septum, B = Border zone. Extensive amounts of Gd-TO (green channel) are seen in the thinned infarct. The border zone contains areas of normal myocardium interspersed with areas showing Gd-TO uptake. No accumulation of Gd-TO is seen in the uninjured septum. (B) High magnification (20×) view of Gd-TO accumulation (green channel) in the infarct. (C) Identical section to that shown in panel B, after nuclear staining with DAPI. (D) Fusion of the Gd-TO (B) and DAPI (C) images. Gd-TO co-localizes very strongly with DAPI, a nuclear stain, but only in areas of infarction. Scale bar = 100 um. (E–H) Flow cytometry and microscopy of activated macrophages exposed to Gd-TO. (E) Flow cytometry reveals that Gd-TO is not taken up by activated macrophages (black curve). Permeabilization of their membranes by exposure to a surfactant, however, results in significant accumulation of Gd-TO (red curve). Fluorescence microscopy of activated macrophages after permeabilization confirms the uptake and strong co-localization of (F) Gd-TO and (G) DAPI. (H) Fused imaged of panels F and G. Scale bar = 30 um.

