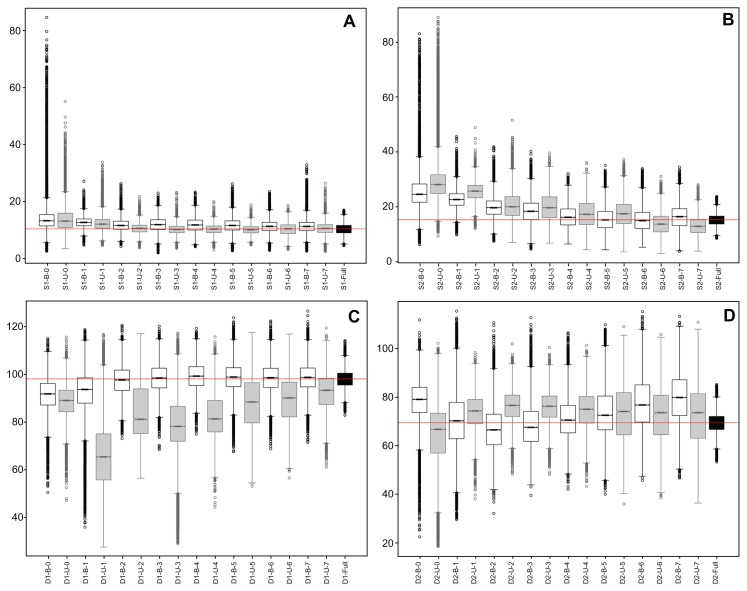
Figure 4.
Boxplots of the posterior distributions of the evaluated taxonomic compositions. Labels represent the balanced (B) and unbalanced (U) topologies. In (A and B), the label numbers identify the number of new terminals between the calibration node and nodes S1 and S2. In (C and D), label numbers identify the number of new terminals inserted after nodes D1 and D2.

