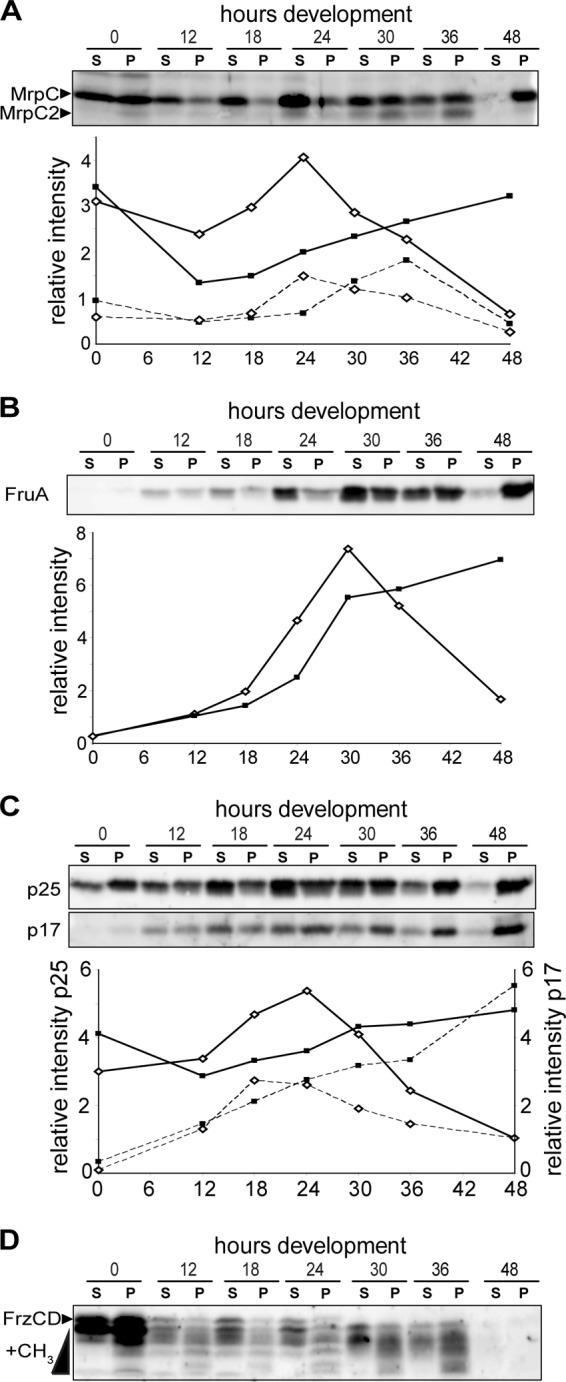
Fig 3.

Cells in the pellet and supernatant fractions display distinct patterns of developmental regulator accumulation. Panels show immunoblot analysis of cells from the supernatant (S) and pellet (P; sedimented) fractions using antisera specific for MrpC (A), FruA (B), CsgA (C), and FrzCD (D). Each lane contains cell lysates generated from 4 × 10⁷ cells. For panels A to C, the respective relative intensity measurements for each band from the supernatant (white diamonds) and pellet (black squares) are shown underneath each blot. Representative intensity plots are shown, but similar patterns were observed in at least two biological replicates. Solid lines, MrpC (panel A) and CsgA p25 (panel C); dashed lines, MrpC2 (panel A) and C-signal (p17) (panel C). The relative signal intensities of p25 and p17 were quantified from different exposure times. (D) The methylated forms (+CH3) of FrzCD are the more rapidly migrating bands.
