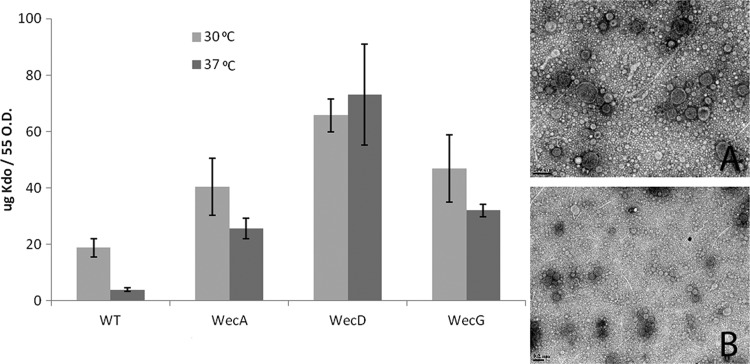
Fig 3.
Interruption of the ECA synthesis pathway at various stages induced OMV formation. Kdo recovered from cell-free supernatants shows increased amounts of vesicles in wecA, wecD, and wecG strains. wecA (inset A) and wecD (inset B) OMVs recovered from 30°C cultures of wecA and wecD strains appear similar to OMVs isolated at 37°C from WT and wecG strains (Fig. 2). The scale bar present at the bottom left of each image corresponds to 200 nm. Average Kdo values were calculated from five separate experiments, and the error bars indicate standard deviations.

