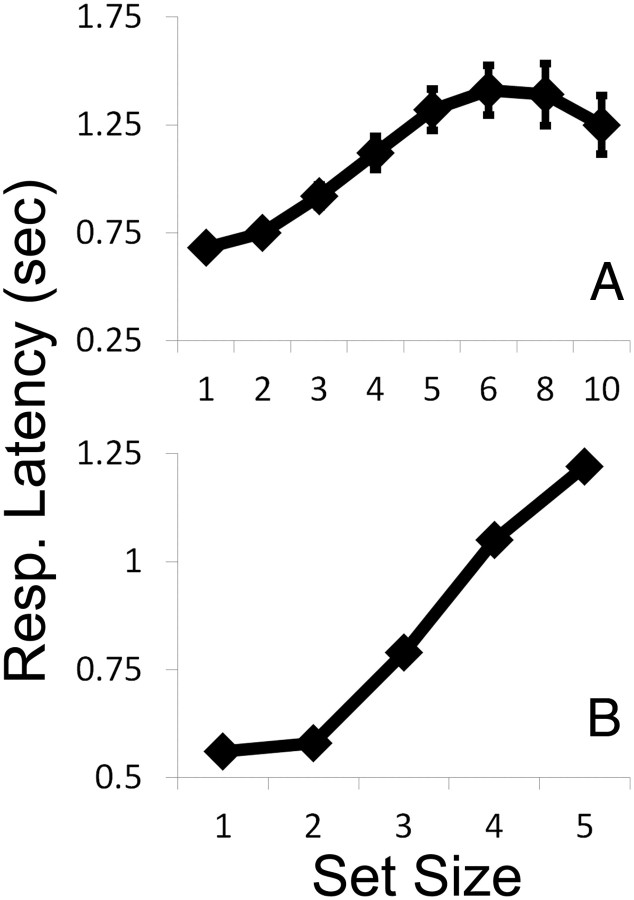
Figure 4.
RT data from experiment 1. A, Mean RTs across subjects are plotted as a function of set size. Error bars are ±1 SEM. B, Data from a representative participant. Note that the profiles depicted in both panels are similar to the group- and single-subject error rates depicted in Figure 2, A and B.

