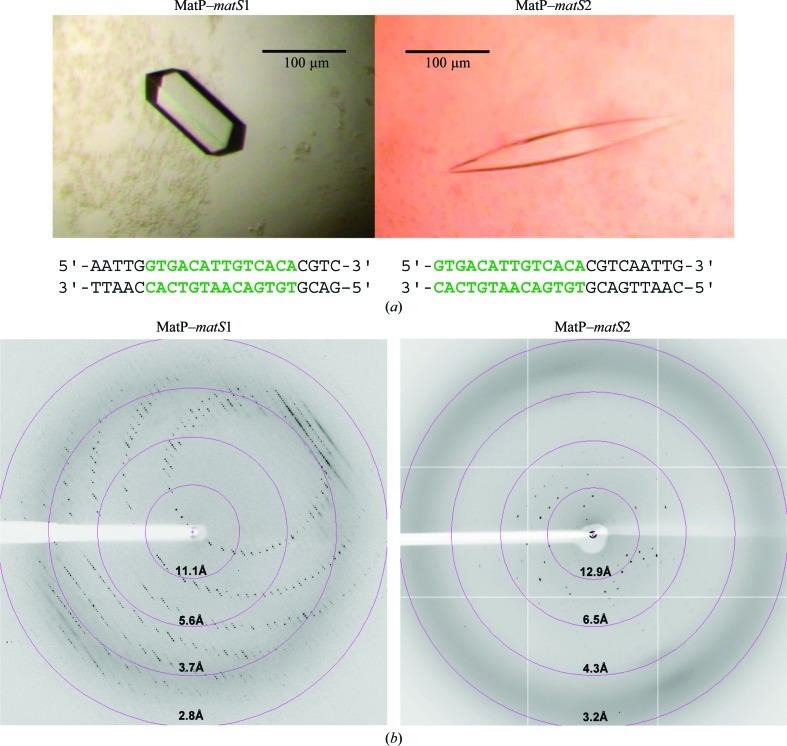
Figure 1.
(a) Crystals of the MatP–matS1 and MatP–matS2 complexes. These crystals were used in data collection (Table 1 ▶). The sequences of the two double-stranded oligonucleotides used for cocrystallization are shown. The 13-mer matS sites are shown in green. (b) Typical 0.5° oscillation diffraction images of MatP–matS1 and MatP–matS2 crystals. Diffaction resolution circles are shown in pink.

