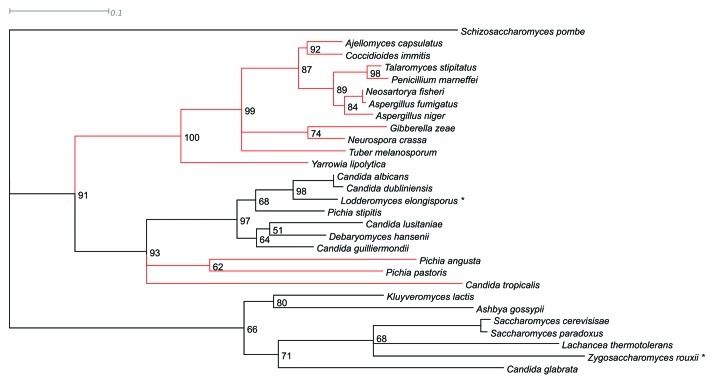
Figure 2.
Phylogenetic tree constructed from alignment and maximum likelihood (quartet puzzling) analysis of 28 S. cerevisiae Str3p homologs. Each branch is indicated with confidence values (0–100%) from 100,000 puzzling steps19 and S. pombe used as an out group. Prediction of peroxisomal targeting signal type 1 (PTS1) was done with the PTS1 predictor (http://mendel.imp.ac.at/mendeljsp/sat/pts1/PTS1predictor.jsp), and sequences devoid of this signal are depicted in red. The sequences were tested for both type 1 and type 2 signals, and marked with asterisk if the prediction was indistinct.

