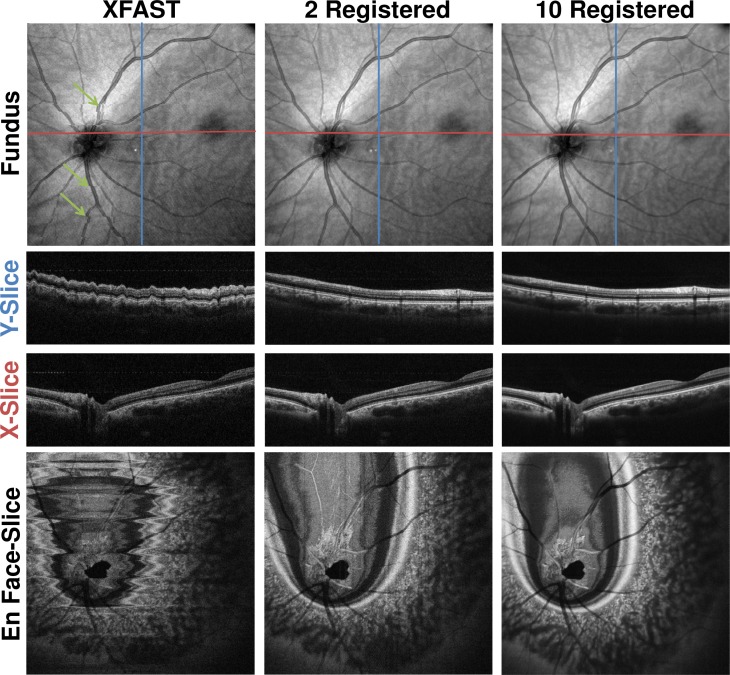
Fig. 11.
Comparison between 12 mm x 12 mm Data Sets from IS3 before and after registration and merging. Top row: En face fundus projections. Second row: Single central slice in Y direction. (blue line in fundus) Third row: Single central slice in X direction. (red line in fundus) Last row: Single central en face slice. First column: XFAST input volume. Second column: Registered and merged result volume using as inputs the volumes of the first two columns. Third column: Registered and merged result volume using all ten volumes from IS3 as input. Cross-sectional images are cropped axially to only show actual structure.

