Fig. 7.
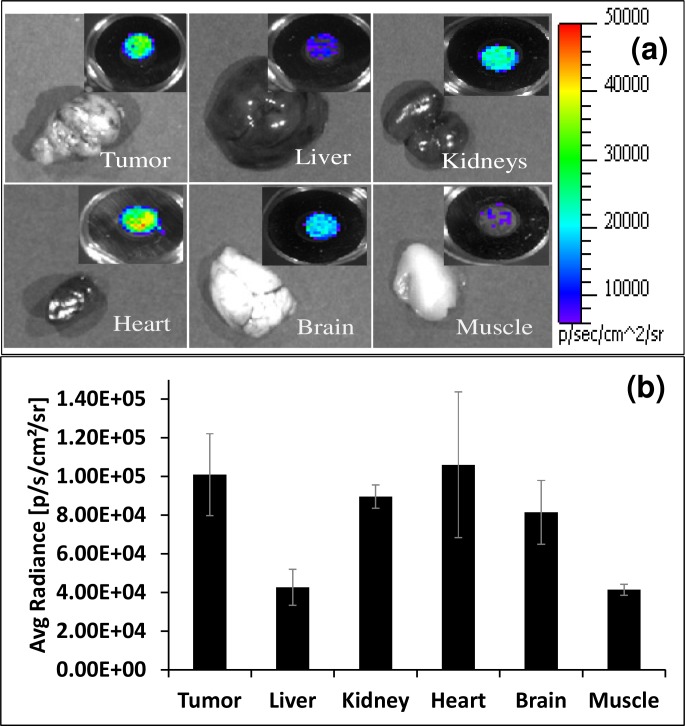
(a) Ex vivo Cerenkov luminescence imaging, with one minute exposure time, of different organs of an animal bearing C6 glioma tumor dissected after one hour post intravenous administration of 900 μCi 18F-FDG. Inset figure on top right corner of each organ represents average Cerenkov radiance detected by a 6 mm fiber optic bundle. (b) Biodistribution of 18F-FDG in various tissues at one hour post injection in mice as measured using Cerenkov luminescence. Respective tissue Cerenkov luminescence was measured by a 6 mm fiber optic bundle (n = 4 for all organs). Bars represent the average tissue uptake plus/minus standard deviation (expressed as % injected dose/g of tissue).

