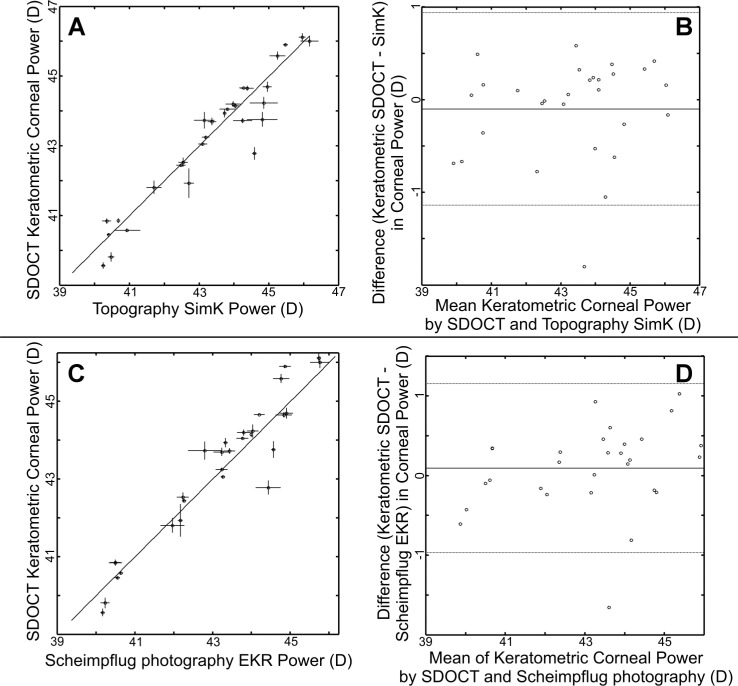
Fig. 3.
SDOCT measurements of keratometric equivalent power compared to topography SimK (A,B) and Scheimpflug photography EKR (C,D). Similar to devices using 1.3375 as the keratometric index of refraction, keratometric equivalent power for SDOCT references the focal point to the posterior vertex (Eq. (3). For each comparison, the left figures (A,C) are direct plots of the mean SDOCT measurements with the mean measurements from the other modality. The vertical error bars represent ±1 standard deviation from the repeated SDOCT measures for that eye. The horizontal error bars represent ±1 standard deviation from the repeated other modality measures for that eye. The solid diagonal line represents the ideal 1:1 case. For the Bland-Altman plots on the right (B,D), the mean of the paired differences is represented by the solid line. The thinner lines above and below represent ±1.96 standard deviations from the mean of the paired differences. The SDOCT pairwise intraclass correlation coefficient to topography was 0.94 and to Scheimpflug photography was 0.98.

