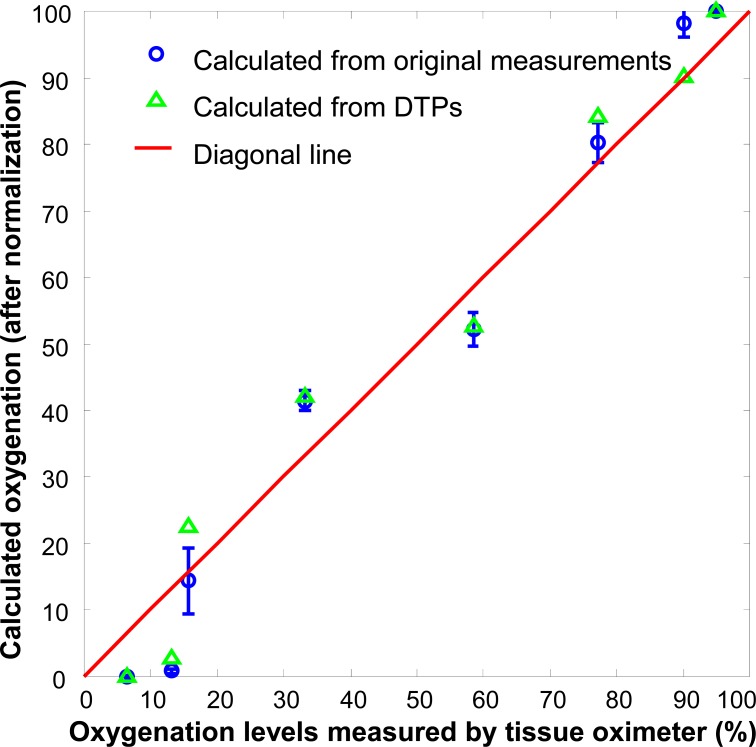
Fig. 10.
Actual phantom oxygenation levels measured by a tissue oximeter versus those reconstructed from the original hyperspectral measurements (blue circles) and from the projected DTPs (green triangles). The solid redline is a 1:1 diagonal line. The reconstructed oxygenation values have been normalized to the scale of 0 to 100. Linear correlation is observed between the reconstructed and the actual oxygenation levels. The error bars indicate the oxygen heterogeneity of the tested blood phantom.

