Fig. 3.
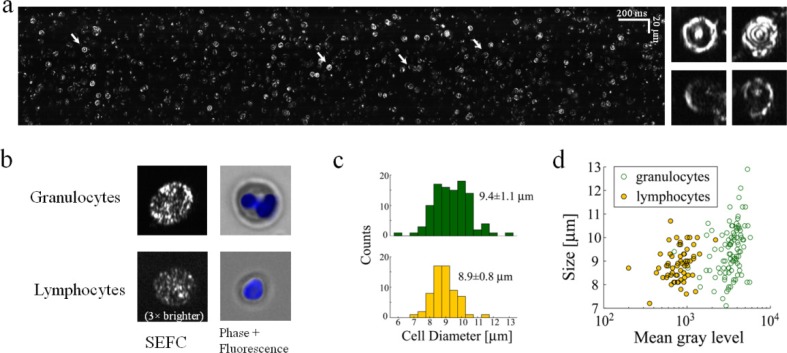
In vitro imaging of flowing blood cells. (a) SEFC raw image of diluted whole blood. Right insets, four individual RBCs of different orientations in space whose location in the raw image is marked by arrows. (b) Typical SEFC images of live granulocytes and lymphocytes separated from whole blood compared to standard fluorescence microscopy. Cells' nuclei were stained blue (Hoechst). The lymphocyte SEFC image was brightened (3×) to allow visual comparison. (c) Diameter histograms of granulocytes and lymphocytes, with corresponding mean ± S.D values. (d) Scatter plot of WBC as function of size and integrated brightness allows good statistical separation of lymphocytes from granulocytes.

