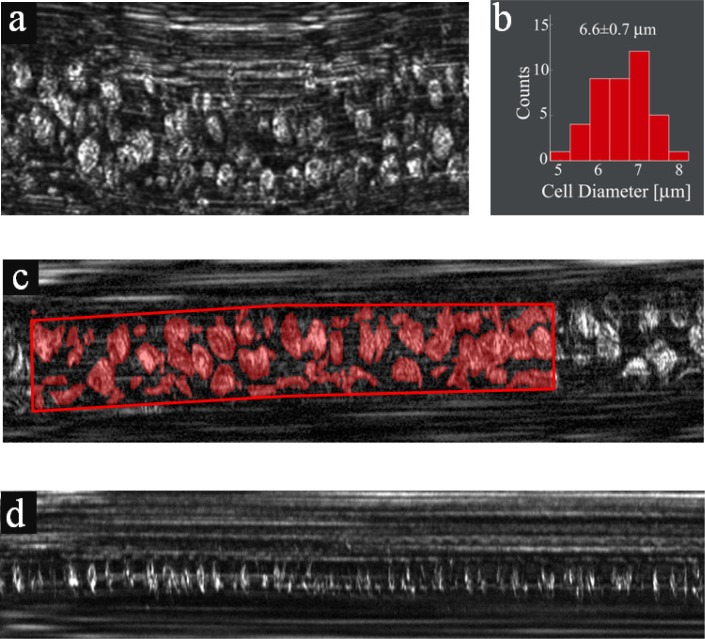
Fig. 5.
In vivo imaging in microvessels. (a) RBC flow in a vessel which was slightly deformed by applying external pressure. (b) A histogram showing distribution of RBC diameters. (c) Extracting the fractional area occupied by RBCs in a vessel using manual segmentation for assessing hematocrit levels. Red regions correspond to areas occupied by RBCs. (d) Individual RBCs flowing in a small-diameter capillary.

