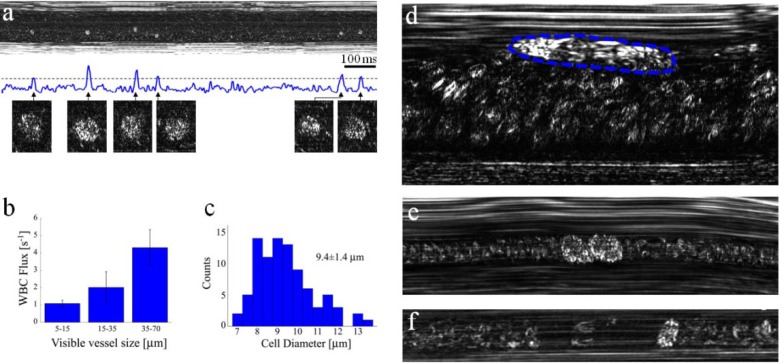
Fig. 6.
In vivo imaging of WBCs. (a) Imaging close to the wall of a post capillary venule allows forming a plot of the total intensity across the image as a function of time. Good correlation between the appearances of WBCs (magnified cell images below the plot) and intensity peaks was obtained. (b) Averaged flux of WBCs for different vessel diameters. (c) Diameter histogram of the imaged WBCs. (d) A single rolling WBC (outlined by a dashed blue line) near a vessel wall, characterized by an elongated shape which indicates its low relative velocity (approximately 0.18 mm/s) in contrast to the nearby fast RBC flow (approximately 1.1 mm/s). (e) Two attached WBCs flowing in a capillary. (f) A single WBC flowing in a small capillary with a downstream plasma gap (RBC depleted region).

