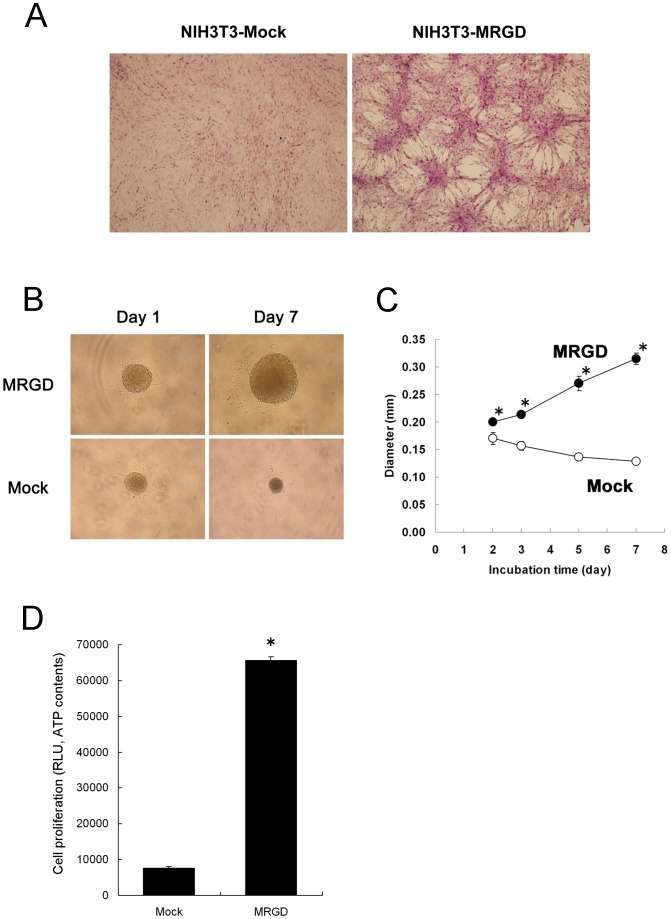
Figure 1. Tumorigenesis of NIH3T3 cells stably expressing MRGD (NIH3T3-MRGD cells).
A. Representative pictures of focus formation in monolayer cultures of NIH3T3 cells stably expressing Mock (NIH3T3-Mock cells, left) or MRGD (NIH3T3-MRGD cells, right). Cells were stained with crystal violet after fixing with 4% paraformaldehyde. B. Representative pictures of NIH3T3-MRGD or NIH3T3-Mock spheroid on Days 1 and 7. C. Spheroid growth curves. The spheroid sizes of NIH3T3-MRGD (closed) or NIH3T3-Mock (open) at Days 2, 3, 5 and 7, are shown with their diameters (mean ± SD). * indicates p<0.005 (Mann-Whitney U test, 2 tails). D. Cell proliferation of spheroid cultures of NIH3T3-MRGD or NIH3T3-Mock. Luminescence of whole cell ATP contents (means ± SD) was measured at 6 days after plating. * indicates p<0.005 (Mann-Whitney U test, 2 tails).

