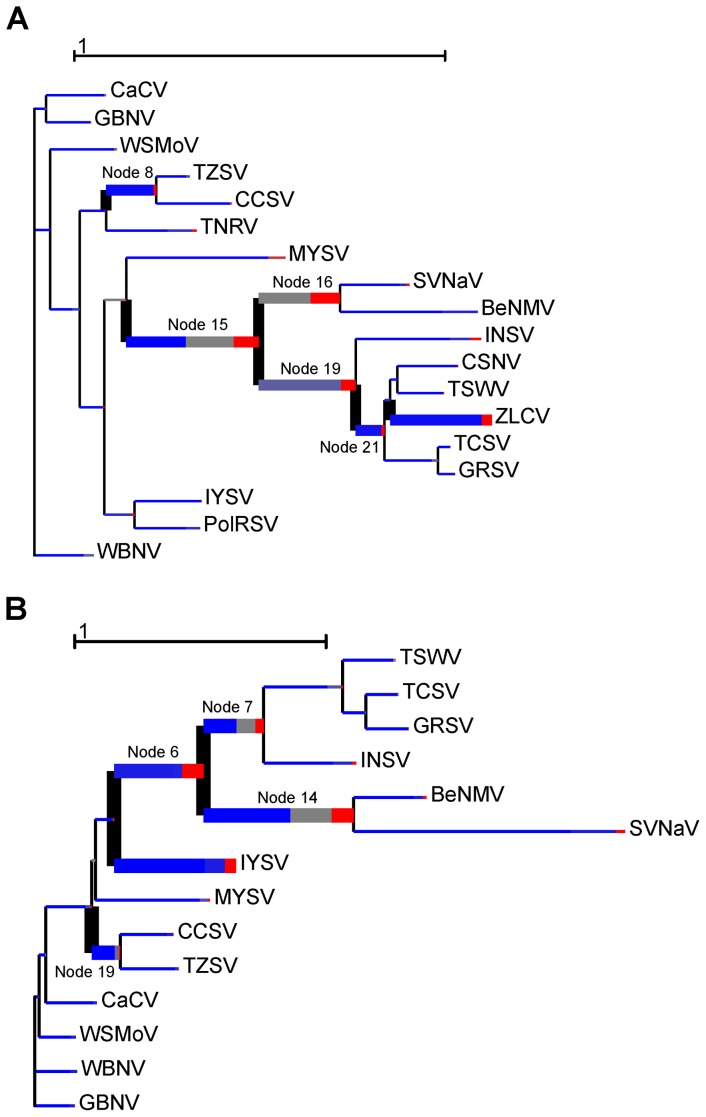
Figure 6. Episodic diversifying selection detected on NSm and RdRp alignments.
Each tree is scaled on the expected number of substitutions/nucleotide. The hue of each color indicates strength of selection, with red corresponding to dn/ds >5, blue to dn/ds=0 and grey to dn/ds=1. The width of each color represents the proportion of sites in the corresponding class. Thicker branches have been classified as undergoing episodic diversifying selection (p>0.05).

