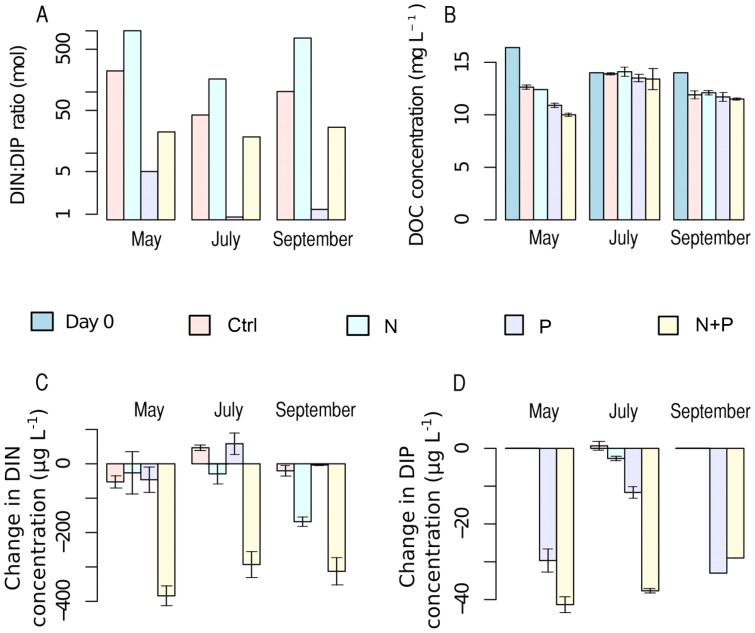
Figure 1. Nutrient and DOC concentrations in the experiments.
DIN∶DIP ratios in the lake and in the amended nutrient treatments on day 0 of each experiment, n = 1 for all (A). Change in DOC concentration during experiments, n = 1 for day 0 and n = 4 for day 7 (B). Change in DIN concentration during experiments (C). Change in DIP concentration during experiments (D). In C-D the change is from day 0 to day 7 and n = 4. Error bars represent standard deviation.

