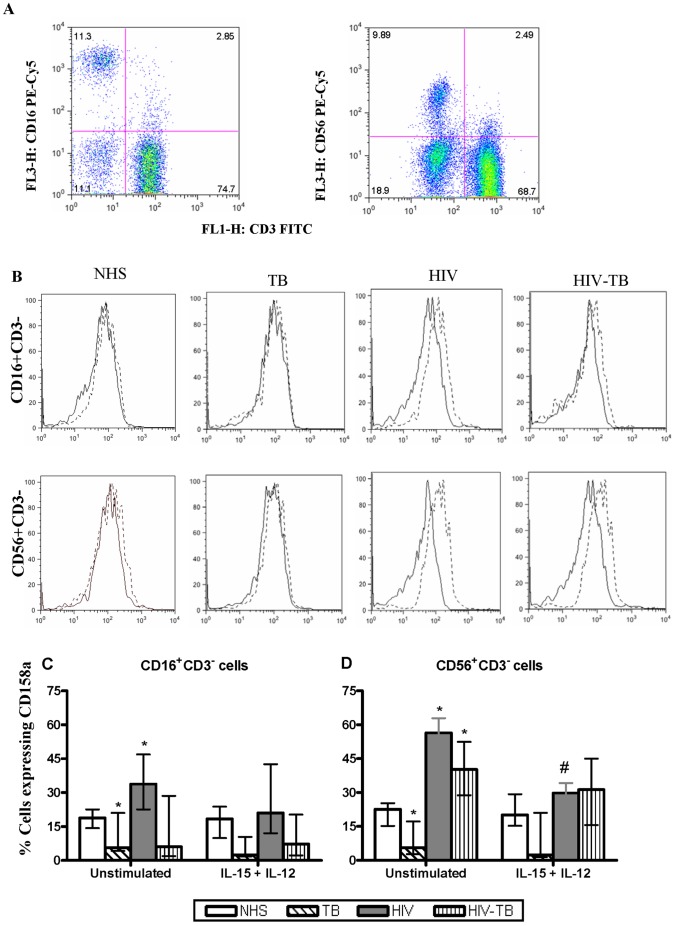
Figure 1. Expression of inhibitory NK receptor CD158a.
Dot plots of CD16+ and CD56+ cells (a), representative histograms of CD16+CD3− and CD56+CD3− cells from the four groups showing the expression of CD158a (b). Dashed line in histogram refers to unstimulated while the thick line represents IL-15+IL-12 stimulation. Effect of IL-15+IL-12 on the CD158a expression from four different groups obtained from 15 individuals (c). Data are presented as median ± IQR. Statistical comparisons between NHS and other groups were performed and the significant values are denoted by *. Statistical analysis between basal and IL-15+ IL-12 stimulation were also carried out and the significant values are showed as #. A p value of <0.05 was considered statistically significant.

