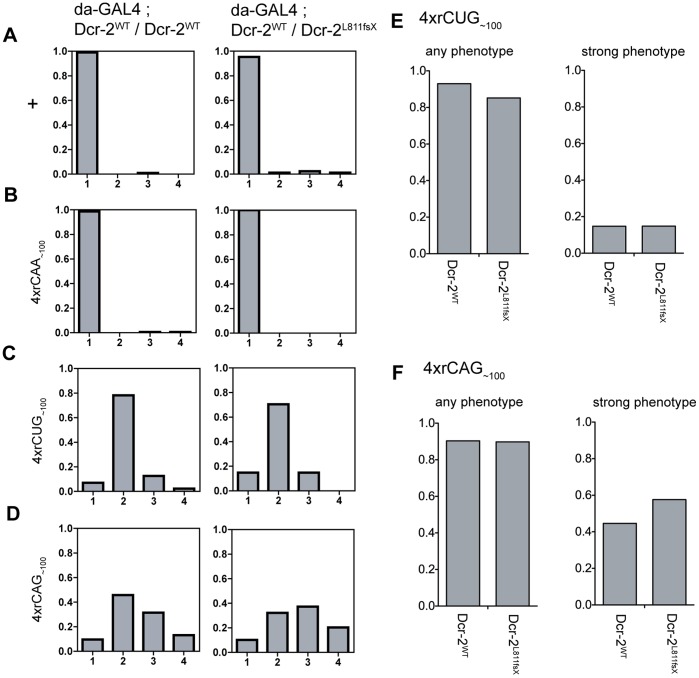
Figure 3. Reducing Dcr-2 levels is not rate limiting for the tergite phenotype.
A-D, Proportion of progeny within each phenotype category when repeat expression is driven by da-GAL4 alone (left column), or in the presence of the Dcr-2L811fsX mutant allele such that Dicer-2 levels are reduced (right column). A, Wild-type control, B, 4xrCAA∼100 [line 1], C, 4xrCUG∼100 [line 1], D, 4xrCAG∼100 [line 2]. E, F, Total proportion for each genotype that shows any phenotype (‘any phenotype’ - category 2, 3 and 4) and the proportion with a strong phenotype (‘strong phenotype’ – category 3 and 4). E, 4xrCUG∼100 [line 1], F, 4xrCAG∼100 [line 2]. None of the observed changes were statistically significant (Fisher’s exact test).

