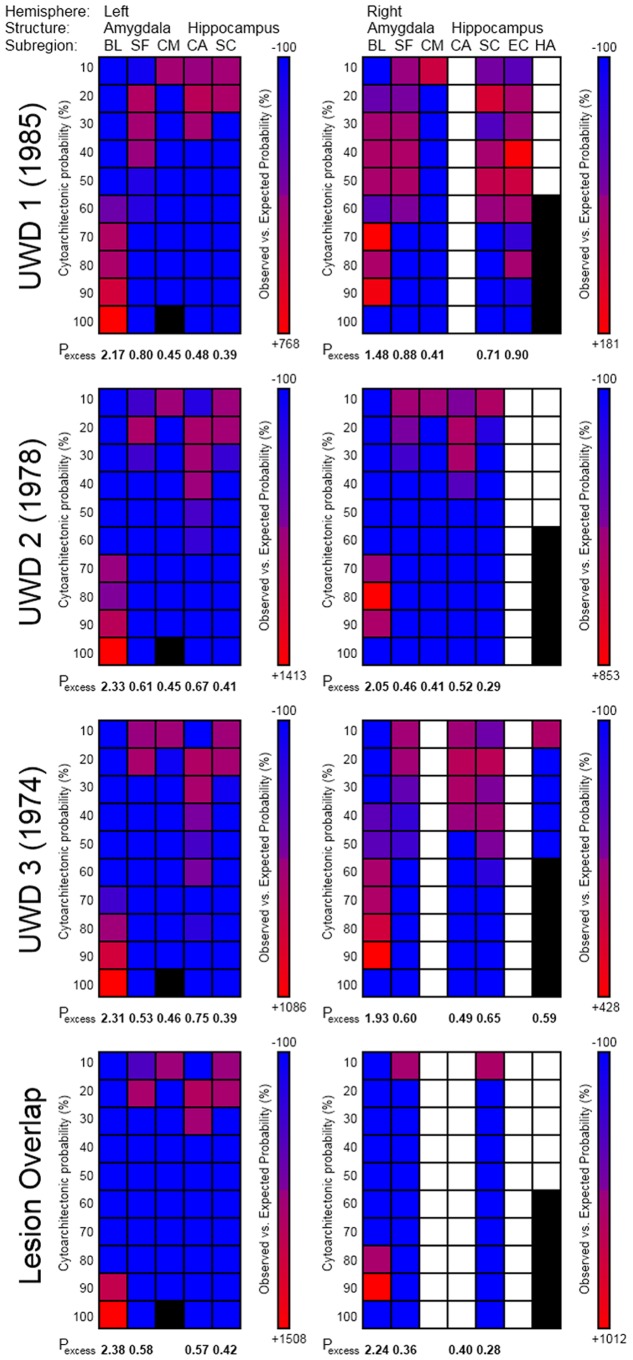
Figure 4. Observed versus expected probability matrices for the individual brain lesions and their overlap.
Columns are the observed brain areas, and rows their cytoarchitectonic probability classes. Colors indicate the relative over- (red) or under- (blue) representation of a structure-class in the lesion volume. White indicates no overlap between lesion and structure probability map, and black indicates probability classes that are not represented in the cytoarchitectonic map. Pexcess values indicate how much more likely a structure was observed in the lesion volume as could be expected from its own probability distribution, and thus reflect how central to the area the lesion volume is. BL = Basolateral, SF = Superficial, and CM = Central-Medial, which are all amygdala subregions, and CA = Cornu Ammonis, SC = Subicular Complex, EC = Entorhinal Cortex, and HA = Hippocampal-Amygdaloid Transition Area, which are all subregions of the hippocampus.

