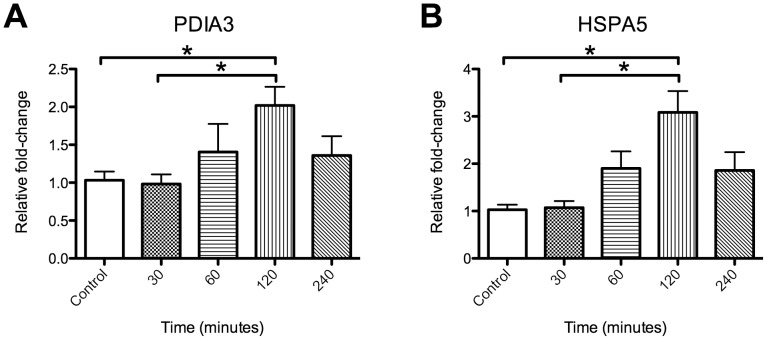
Figure 2. PDIA3 is increased by METH in rodents in vivo.
Time course of gene expression, determined by qRTPCR, in striatum from mice treated with 10 mg/kg METH at the indicated time points. (A) PDIA3 (B) HSPA5 (as a positive control). *p<0.05 as determined by a one-way ANOVA followed by a post hoc Tukey's test.

