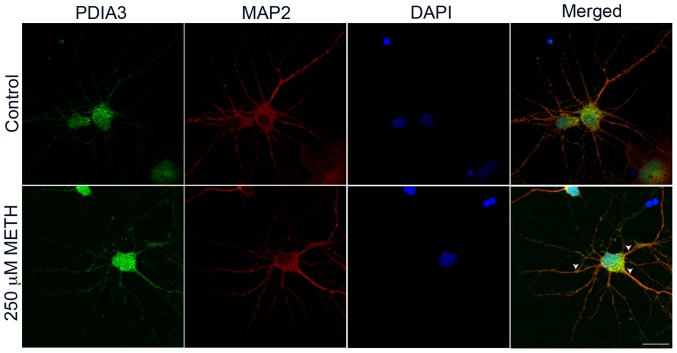
Figure 3. METH induction of PDIA3 in vitro in rodent neurons.
Primary rat striatal neurons (8 DIV) stained for levels and distribution of PDIA3 after 250 µM METH treatment for 24 h along with MAP2 staining for neuronal structure and DAPI for cell nucleus. Control cells show basal levels of PDIA3 while cells treated with METH show an increase and redistribution of PDIA3 along the neuronal processes indicated by arrowheads. Scale bar = 10 µm.

