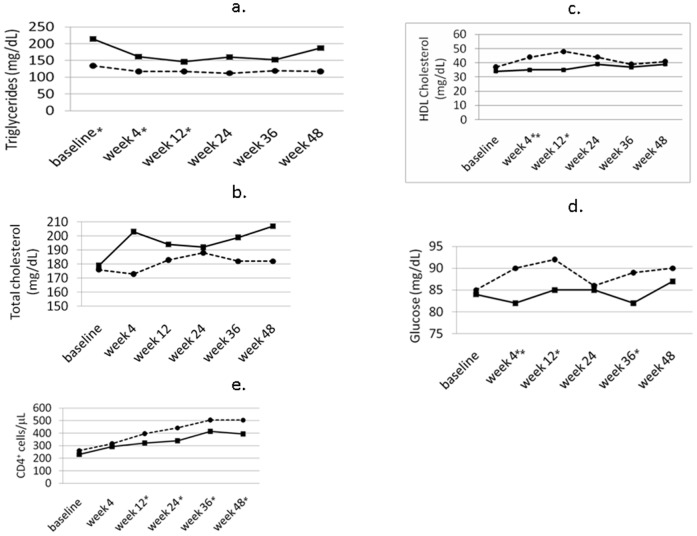
Figure 1. Changes in metabolic variables and CD4+ cell counts over time in patients on ART (solid line, squares) or ART with MVC (broken line, circles).
* denotes p<0.05 and ** p<0.01 for differences between the two patient groups at the time shown (Mann-Whitney test after non parametric analysis of variance for repeated measures).

