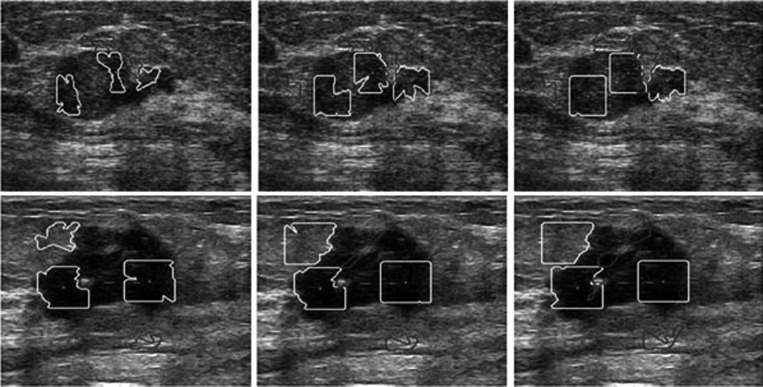
Figure 14.
Influence of the energy threshold τ for HP construction. The areas enclosed by light color (yellow in online version) contours represent HPs in the smooth regions, whereas those enclosed by dark color (blue in online version) contours are HPs in the nonsmooth regions. Gray (red in online version) dots are the central pixels. From left to right threshold τ = {0.86, 0.76, 0.66} for row 1 and τ = {0.95, 0.9, 0.8} for row 2. The original images can be seen in Fig. 9a in row 1 and Fig. 2a in row 2.

