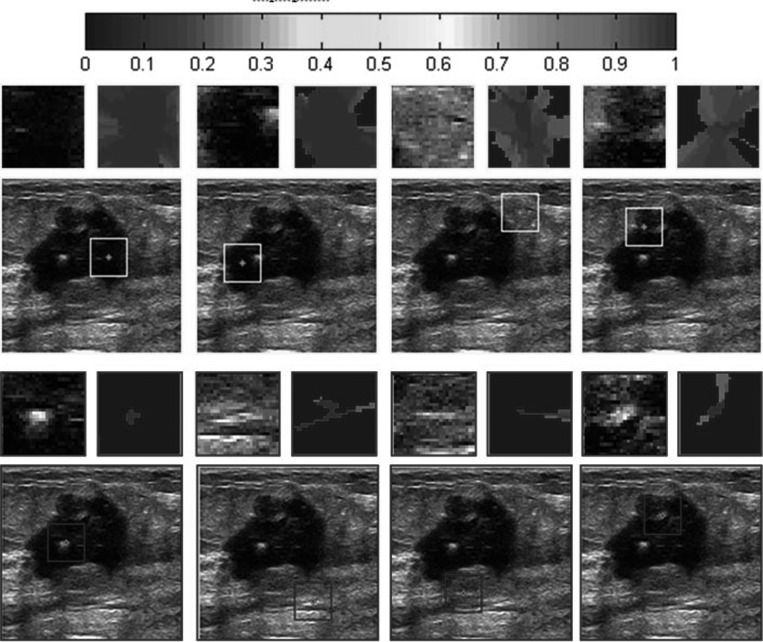
Figure 5.
Examples of HPs on a breast US image. Eight search windows located in smooth region (outlined with light color (yellow in online version) squares) or nonsmooth region (outlined with dark color (blue in online version) squares) are listed in a test image. The specified area inside each search window is zoomed and displayed above the images. The corresponding HPs are displayed on the right and shown in color-coding. Along with the increase of the membership, the color varies from blue to darker red as shown by the color bar displayed at the top of the figure (available in online version).

