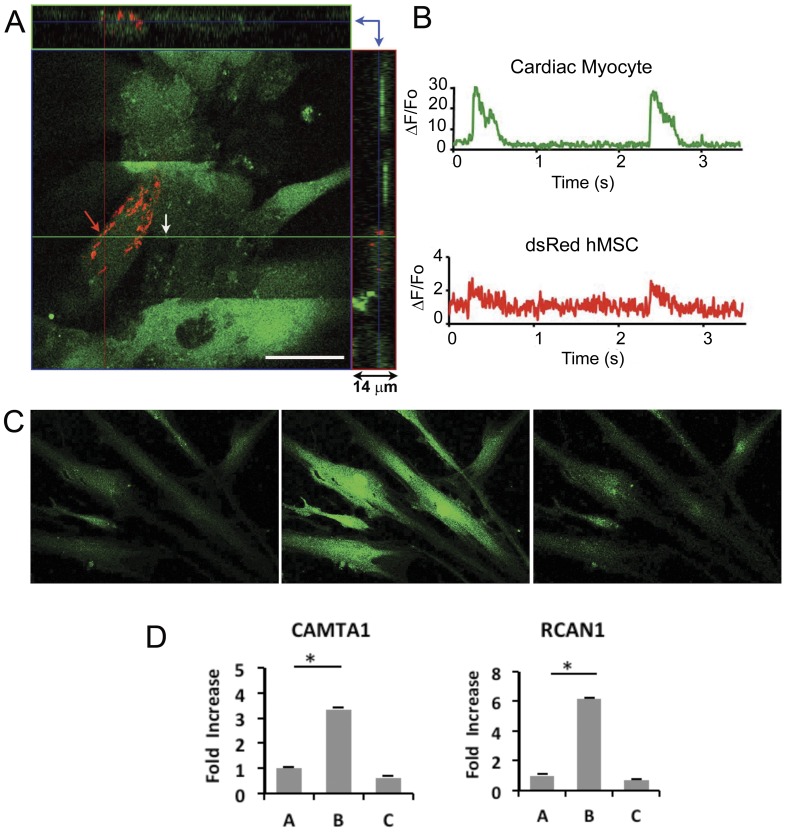
Figure 2. Intracellular Ca2+ signals acquired from a dsRed hMSC and neonatal cardiac myocyte, after 48 hrs in co-culture.
(A) Illustrates the three dimensional distribution of hMSCs and cardiac myocytes in co-culture. The image shows a 1.0 µm confocal optical section from a 14 µm thick co-culture. The section shown corresponds to the regions indicated by the blue arrows, confirming that the cells were not overlapping (right upper quadrant). A line scan was acquired along the green horizontal line. Scale bar = 20 µm. (B) Using confocal line scan microscopy Ca2+ oscillations corresponding to the hMSCs (red arrow in A) and a cardiac myocyte (white arrow in A) were recorded. Top panel shows Ca2+ oscillations recorded in the cytosol of a cardiac myocyte, noted by the white arrow in A. Bottom panel shows perinuclear Ca2+ oscillation recorded from a young dsRed hMSC adjacent to a cardiac myocyte (red arrow in A). Note the difference in Ca2+ signal amplitude at this early time point. Ca2+ signals were recorded on a Zeiss laser scanning confocal microscope at room temperature. All cells were labeled with Fluo-4 AM. Cardiac myocytes were beating spontaneously. (C) Human MSCs response to ionomycin. Fluo-4 fluorescence measured in naive hMSCs in monoculture (left panel), 10 sec after the application of 1 µMol/L ionomycin (middle panel), and 60 sec after the application of 2 mMol/L EGTA (right panel). (D) Transcriptional response to ionomycin-induced intracellular calcium in hMSCs in monocultures. Human MSCs in monocultures were stimulated for 6 hrs with 0.6 µMol/L ionomycin. RT-qPCR from RNA harvested from A: Untreated, control hMSCs. B: hMSCs after 6 hr ionomycin stimulation, C: hMSCs stimulated for 6 hrs with ionomycin, washed, cultured in fresh medium and harvested after 24 hrs of ‘recovery’. Expression of CAMTA1 (left panel); RCAN (right panel). The bars show mean ± SEM, *p<0.05.

