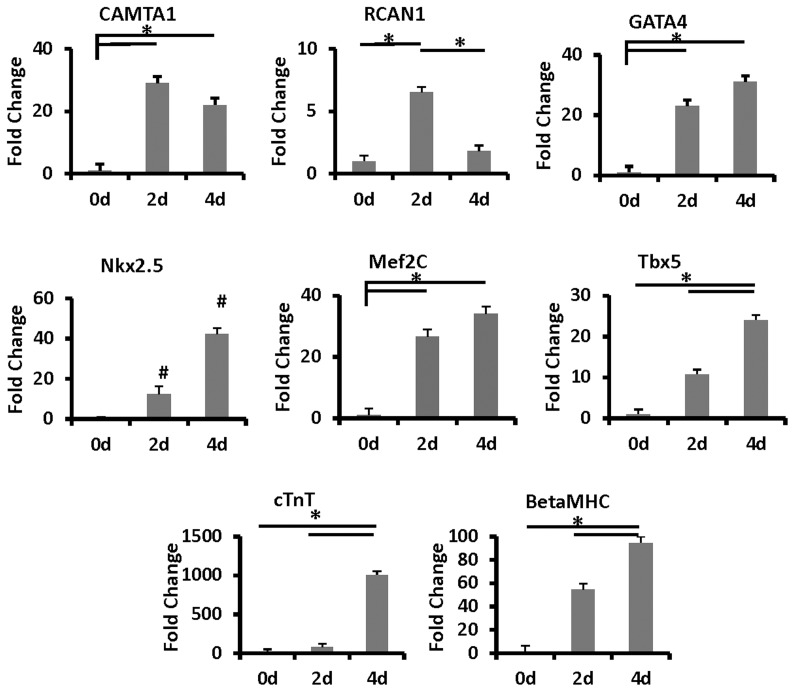
Figure 3. Time course of RNA expression levels of cardiac transcription factors and contractile protein genes in hMSCs co-cultured with rat neonatal cardiomyocytes.
Control levels of CAMTA1, RCAN1, GATA4, Nk×2.5, Mef2c, Tb×5, cTnT, and BetaMHC in the stem cells in monoculture at day 0 (0d), or co-cultured with cardiomyocytes for 2 days(2d) and 4 days (4d). The bars show mean ± SEM, *p<0.05. # denotes novel expression in Nkx2.5.

