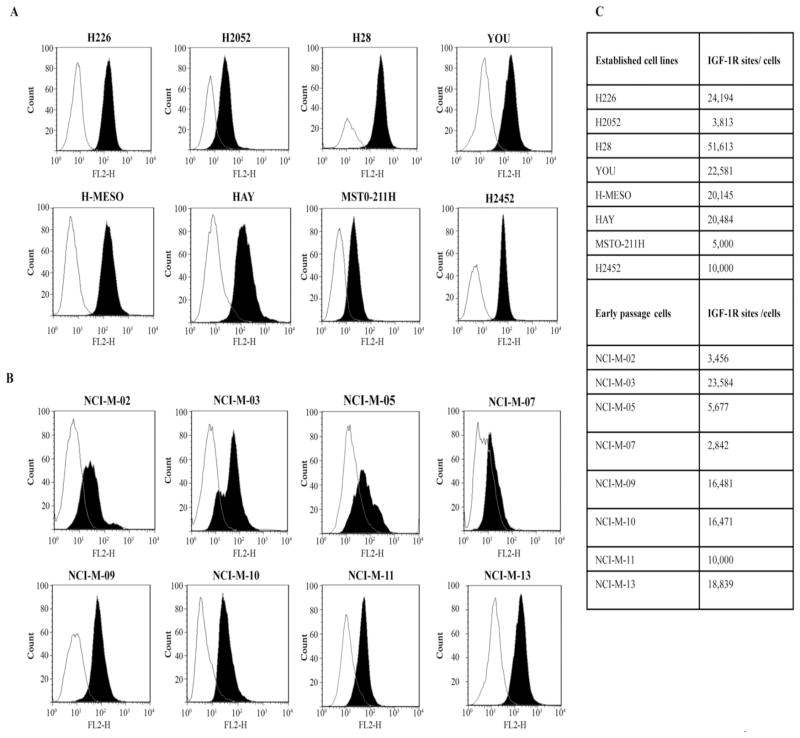
Figure 2.
FACS analysis for cixutumumab binding in established (A) and in early passage (B) mesothelioma cells. Cells were incubated with cixutumumab or isotype control antibody at 4°C for 1 hr, followed by incubation with an anti-human antibody IgG–phycoerythin conjugate. Results are shown in terms of histogram plot for each cell line depicting the binding of the cixutumumab (solid black) and the binding of isotype control antibody (white). (C) Table summarizing IGF-IR sites/cell in the mesothelioma cell lines that was determined using a cell surface IGF-IR quantitation assay.

