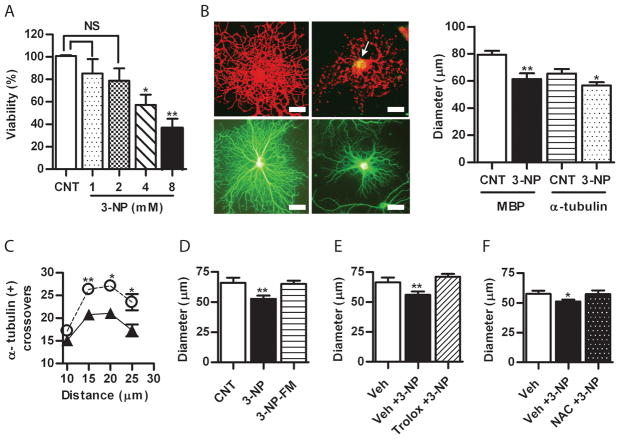
Figure 1.
A) Quantitative estimation of 3-NP toxicity at increasing concentrations assessed by the uptake of neutral red. Viability is expressed as the percentage of control (mean ± SEM). NS, non-significant, one-way ANOVA. *p<0.05 ; **p<0.001 Student’s t test as compared to control (CNT). B) Left panels, microphotographs of immunofluorescence with anti-MBP (red, upper) and anti-α-tubulin (green, lower) of rat primary oligodendrocytes (OLGs) incubated in the absence or the presence of 1 mM 3-NP for 1 h. Arrow indicates ROS accumulation in the merge of immunofluorescence with anti-MBP (red) and the fluorescence of 6CDFDA (green). Scale bar=10μm. Right panel, quantification of OLGs diameter after immunofluorescence as describe above. Bars represent the mean ± SEM of at least 25 cells for each condition. Three independent experiments were done. **p<0.001 Student’s t test as compared to control (CNT). C) Plot of the number of α-tubulin-positive processes intersections with concentric circles at increasing distance from the centre of the cell body. *p<0.05, Student’s t test of controls (○) vs 3-NP (▲) at each distance point. D) Reversibility of OLG process retraction induced by 3-NP after replacement with fresh medium (FM) without 3-NP (3-NP-FM). Effect of preincubation with E) Trolox and F) NAC in the process retraction mediated by 3-NP. Bars represent the mean ± SEM of OLG diameters. *p<0.05; **p<0.001, one-way ANOVA. Veh, PBS.

