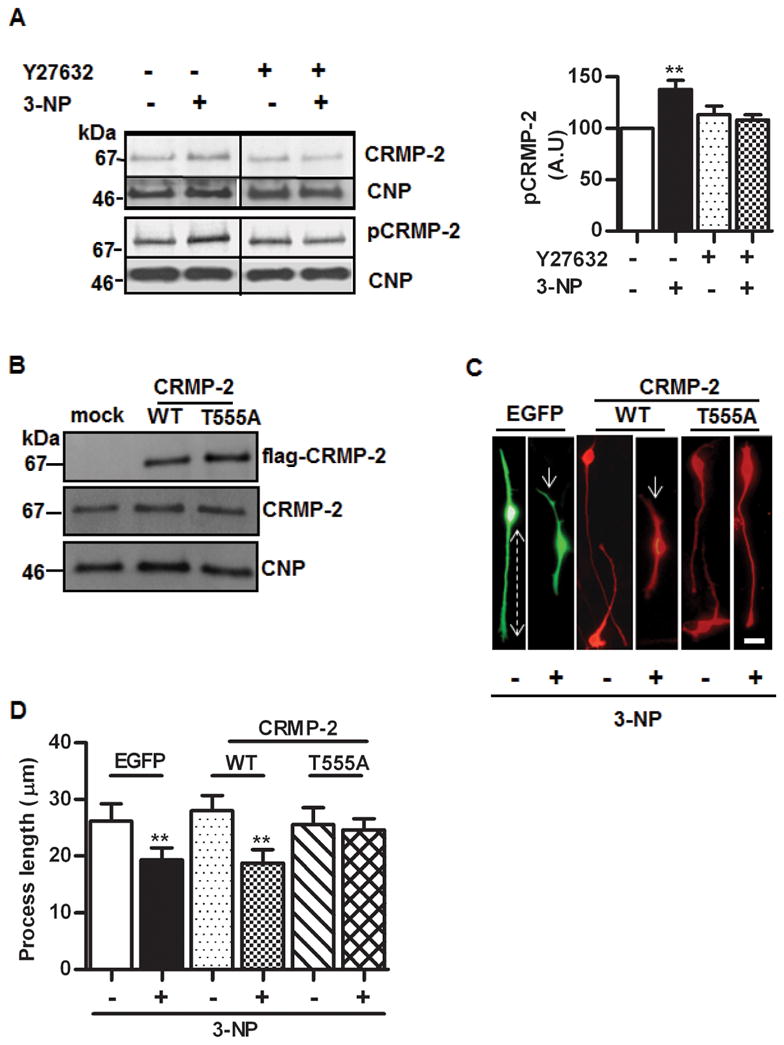
Figure 4.

A) Left upper panel, representative Western blots of OLN-93 proteins with anti-CRMP-2 showing the effect of 3-NP and its prevention by ROCK inhibitor Y27632. Lower panel, Western blots with anti-CRMP-2 specific for the phosphorylated epitope T555 (the ROCK site). In both cases, membranes were probed with anti-CNP for control of protein loading. Right panel, quantitative assessment of the increase of CRMP-2 phosphorylated at T555 induced by 3-NP and its prevention by Y27632. Bars represent the mean ± SEM of immunoreactivity, in arbitrary units (A.U.), expressed as percentage of control. B) Western blot of OLN-93 cells transiently transfected with empty vector (mock), wild type CRMP-2 (WT) or the mutant CRMP-2 T555A (T555A). Anti-flag was used to detect transfected proteins (upper panel); anti-CRMP2 was used to assess levels of total CRMP-2 (middle panel). In both experiments, the same membranes were probed with anti-CNP (lower panel) for protein loading control. C) Representative microphotographs showing OLN-93 cells transfected with EGFP, or with wild type CRMP-2 (WT) or CRMP-2 T555A mutant (T555A), treated (+) or not (−) with 3-NP and probed with anti-flag. Dotted line shows the distance from the centre of the cell to the end of the process, used to quantify the retraction. Arrows depict process shortening induced by 3-NP. Note the prevention of the effect in T555A cells. Scale bar=10μm. D) Quantitative assessment of the process length in EGFP, CRMP-2 WT or CRMP-2 T555A transfected cells in the presence (+) or absence (−) of 3-NP. Bars represent the mean ± SEM for each experimental situation. **p<0.001, one-way ANOVA. RE: JNC-E-2011-1028.R1
