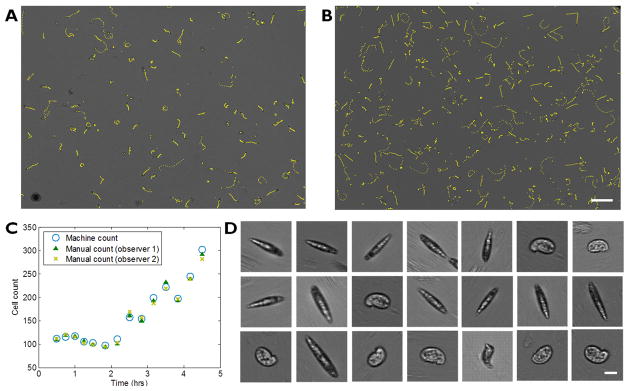
Figure 4.
Longitudinal imaging of Euglena gracilis on ePetri dish. (a), (b) Large FOV images of Euglena gracilis at 1hr and 4.5 hrs, respectively. Yellow line shows traces of each cell for 1 second. (Scale bar 200 μm) (c) Growth in cell population counted with our cell counting software (blue) and manually counted (green, yellow). (d) High resolution images of Euglena gracilis reconstructed with SPMM method (selected). Scale bar indicates 20 μm.

