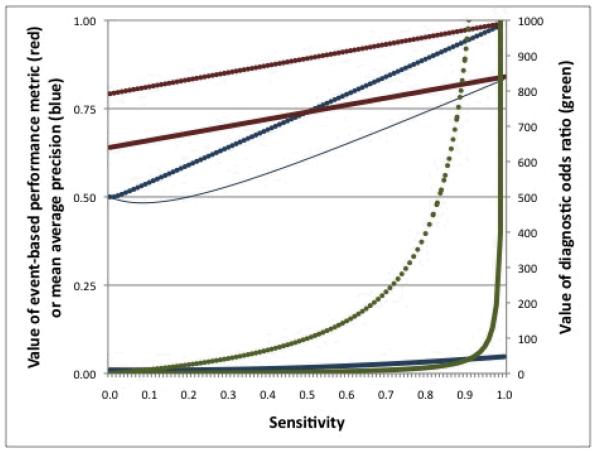
Figure 2.
Behaviors of three metrics at varying parameter values
Plotted is the event-based performance (EBP) metric with w = 0.20 (red; left vertical axis), the diagnostic odds ratio (DOR; green; right vertical axis), and mean average precision (blue; left vertical axis) across values of sensitivity (horizontal axis) when prevalence (i.e. proportion of all scenarios that contain true safety issues) = 0.50 and specificity = 0.80 (thin solid lines), prevalence = 0.50 and specificity = 0.99 (dotted lines), and prevalence = 0.01 and specificity = 0.80 (think solid lines). The thin solid and thick solid lines are superimposed for EBP and for DOR.

