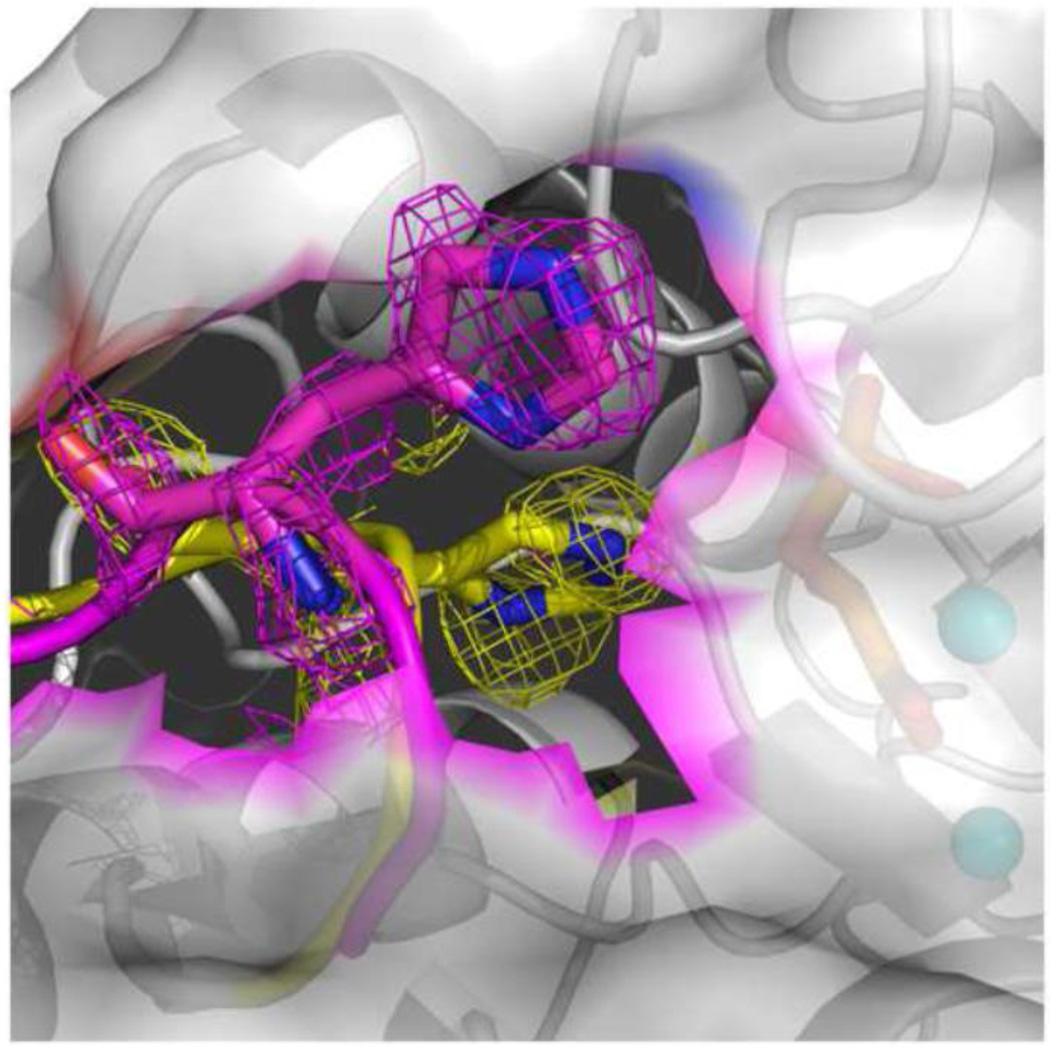
Figure 3.
Two conformations of loop 155–159 in subunit B in the hNSE complex with PGA/PEP. The yellow model and map denotes the closed conformation, pink the semi-closed conformation. The alternative positions of the side chain of His157 can easily be distinguished. Electron density is from the final omit map with Fo-Fc coefficients; the contouring level is at a 0.8 σ level.

