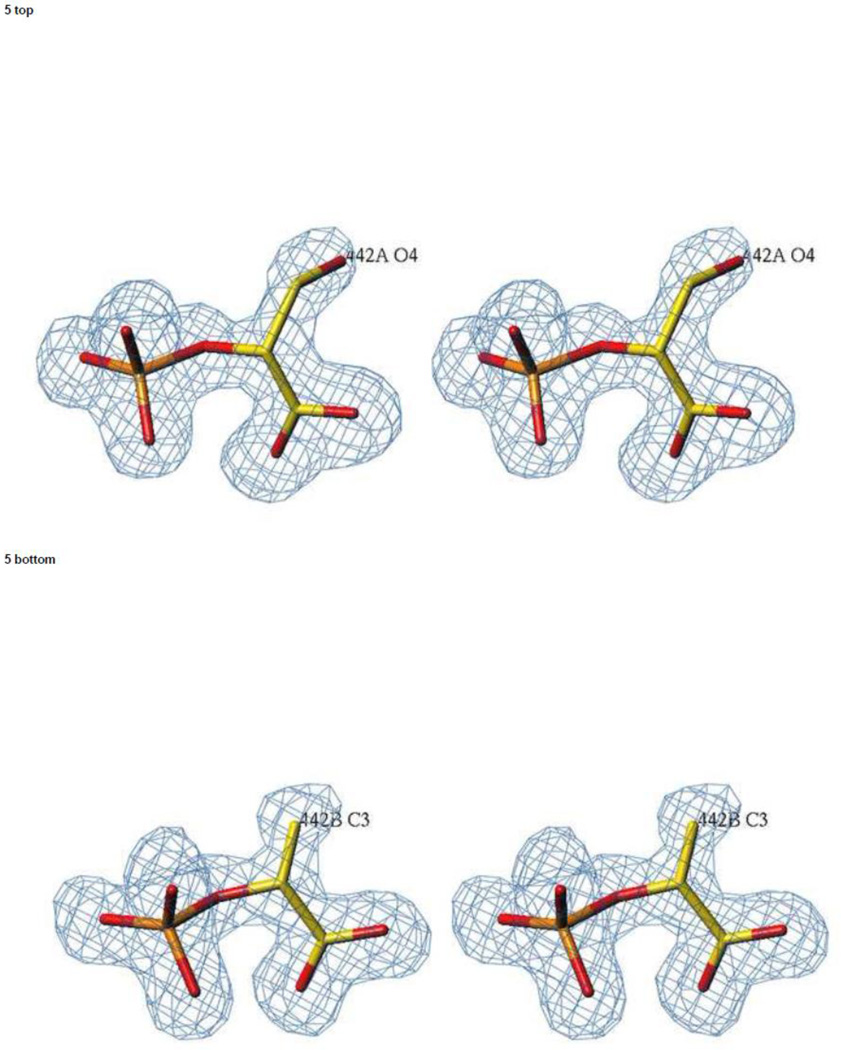
Figure 5.
The ligands in the heteroinhibitory hNSE complex. Stereoviews of electron density were calculated with Fo-Fc coefficients for a model in which the ligands present in the picture were omitted. The contouring is at a 3.0 σ level. Data at 1.4 Å resolution were used. Upper panel: subunit A in which a TSP molecule is present (it binds PGA in the catalytic complex). The orientation is selected to emphasize the presence of oxygen at carbon-3, the one at the top. Lower panel: subunit B in which a LAP molecule is the dominant ligand. There is no density for an oxygen atom at carbon 3 indicating the identity of LAP.

