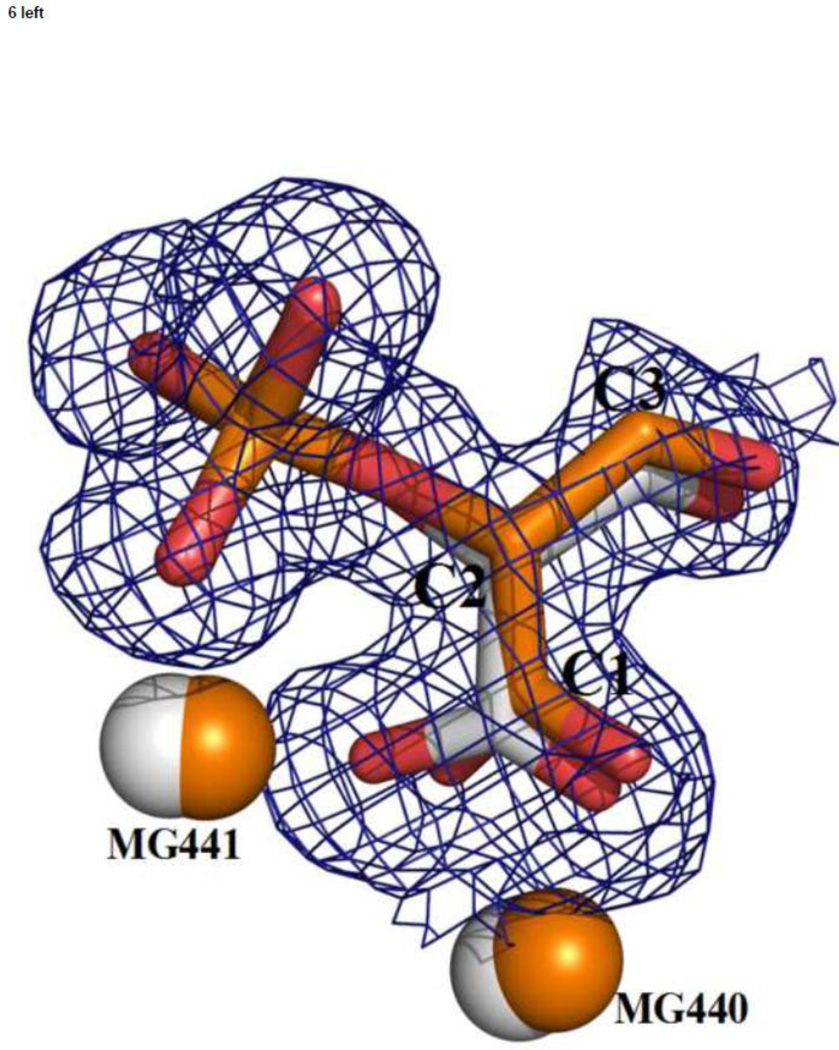
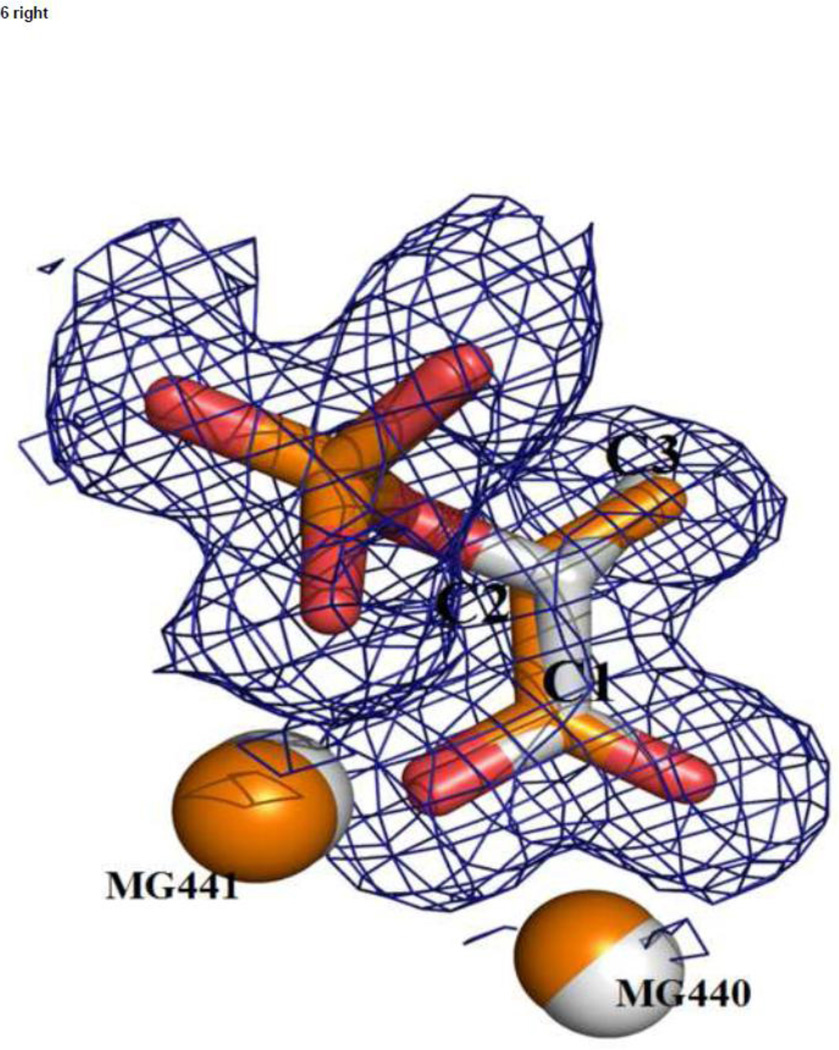
Figure 6.
A superposition of the catalytic and inhibitory complexes (based on Cα positions) shows how well the inhibitor molecules match those of the substrate/product; (left) TSP (in silver, lighter color) and PGA (in orange, darker color); (right) LAP (in silver, lighter color) and PEP (in orange, darker color). Electron density is from the heteroinhibitory complex.


