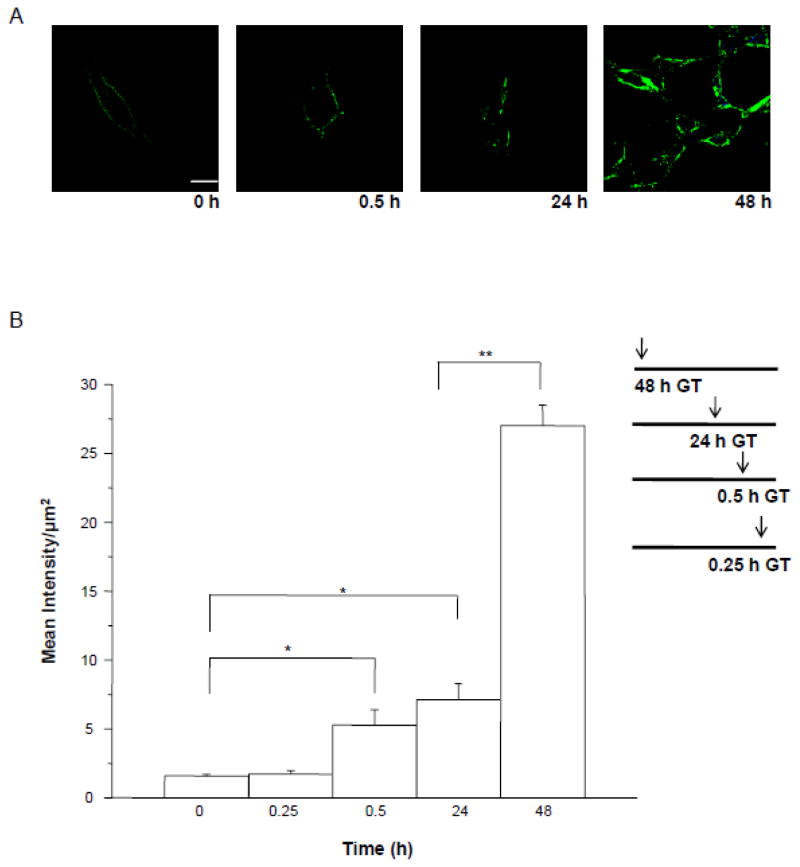
Figure 3. Time-course of the effect of GABA plus THP on surface expression of α4Fβ2δ in HEK-293 cells.
A, Representative confocal images (63X) show an increase in surface expression first detectable after 0.5 h exposure of HEK cells to GABA (10 μM) + THP (100 nM), Anti-FLAG, Alexa-488 F(ab′)2 (green); cell stain, DAPI (blue). Scale bar, 10 μm. B, Averaged data. Peak levels of expression are achieved at 48 h treatment. All timed treatments terminated at the conclusion of the 48 h incubation period (timeline inset, GT, GABA plus THP). Vehicle, 0.01% DMSO. ANOVA, F(4,20) = 71.4, P<0.0001. *P< 0.05 vs. 0 h, 0.25 h; **P<0.05 vs. other groups.

