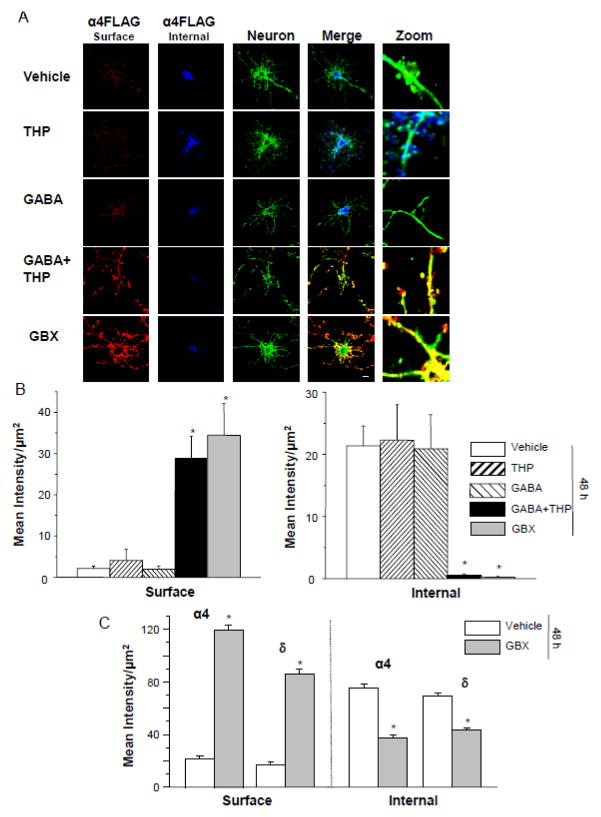
Figure 7. Expression of transfected α4Fβ2δ and native α4 and δ subunits in cultured hippocampal neurons.
A,B, Cultured neurons (8 d) were transfected with α4F, β2 and δ (48 h). A, Left to right, Representative confocal images (63X) of α4 FLAG labeling from the surface (546 λ, red, non-permeabilized) and internal (350 λ, blue, permeabilized) sites; neuron, F-actin labeling with phalloidin (488 λ green), merge, merged images; zoom, representative zoomed images. Immunostaining performed after 48 h treatment with (top to bottom) vehicle (0.01% DMSO), THP (100 nM), GABA (10 μM), GABA + THP or gaboxadol (GBX, 10 μM). Both GABA + THP and GBX treatments produced highly visible surface α4FLAG labeling, which was nearly undetectable in the other groups. Internal labeling was greatest in THP, GABA and vehicle-treated groups. Scale bar, 10 μm. B, Averaged data. ANOVA, Surface, F(4,40) = 15.2, P<0.0001; Internal, F(4,40) = 7.24, P = 0.0002. *P<0.05 vs. THP, GABA and vehicle groups. C, Untransfected neurons treated with GBX or vehicle for 48 h. Averaged data for surface and internal expression of native α4 and δ expression. Surface α4, t(36)=23.3; surface δ, t(36)=17.1; internal α4, t(36)=9.38; internal δ, t(36)=10.69; *P<0.0001 vs. vehicle.

