Fig. 9.

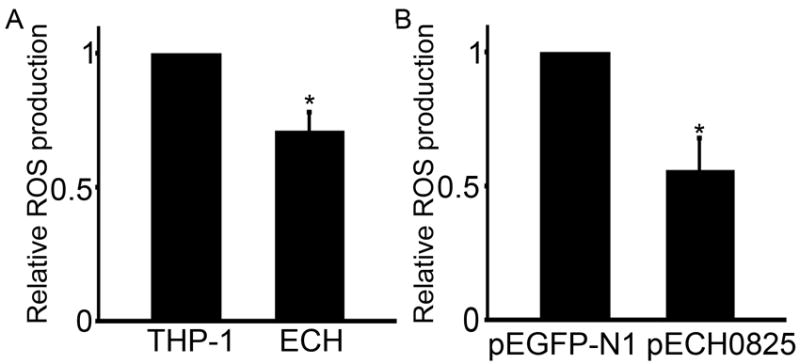
ROS production is reduced by E. chaffeensis infection or ectopically expressed ECH0825.
ROS production after 2 days of culture of E. chaffeensis-infected relative to uninfected THP-1 cells (A), and of pECH0825-transfected relative to pEGFP-N1-transfected HEK293 cells (B). ECH, E. chaffeensis-infected THP-1 cells. Data are expressed as the mean ± standard deviation (n = 3) and are representative of two independent experiments with similar results. *Significantly different by Student’s t-test (p < 0.05).
