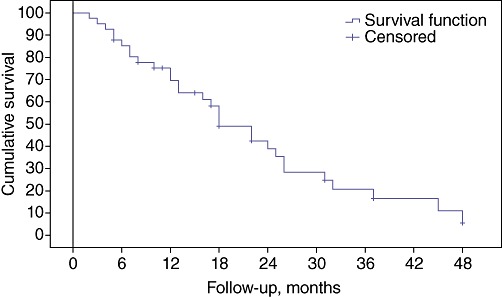
Figure 3.

Kaplan–Meier curve showing survival function of the entire cohort of patients affected by hepatocellular carcinoma treated with at least one session of transarterial chemoembolization. Patients at risk: at 6 months, n= 34; at 12 months, n= 26; at 18 months, n= 23; at 24 months, n= 11; at 30 months, n= 8; at 36 months, n= 5; at 42 months, n= 3; at 48 months, n= 1
