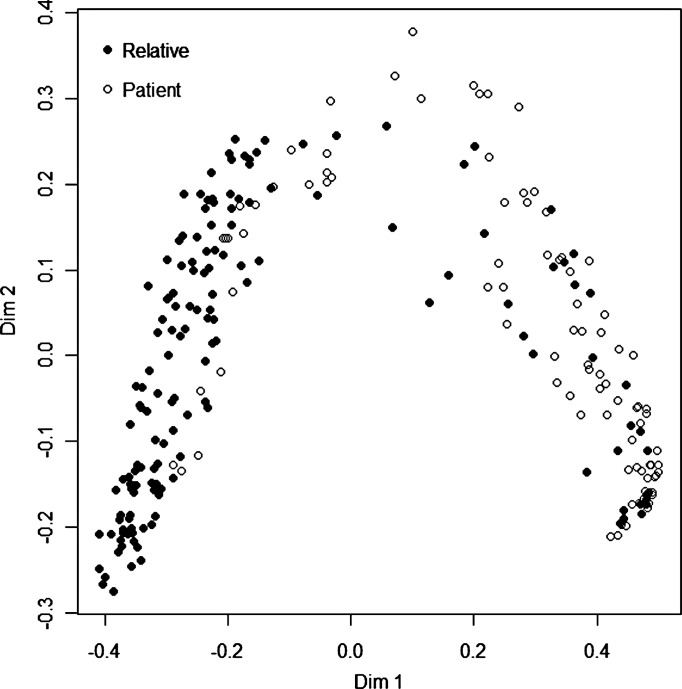
Figure 2.
Visualisation of multidimensional scaling demonstrating clustering of first-degree relatives and patients with rheumatoid arthritis according to a set of predictive variables in a Random Forest model. The two axes represent the dominant clustering directions between the groups scaled as proximities. Dim, dimension.

