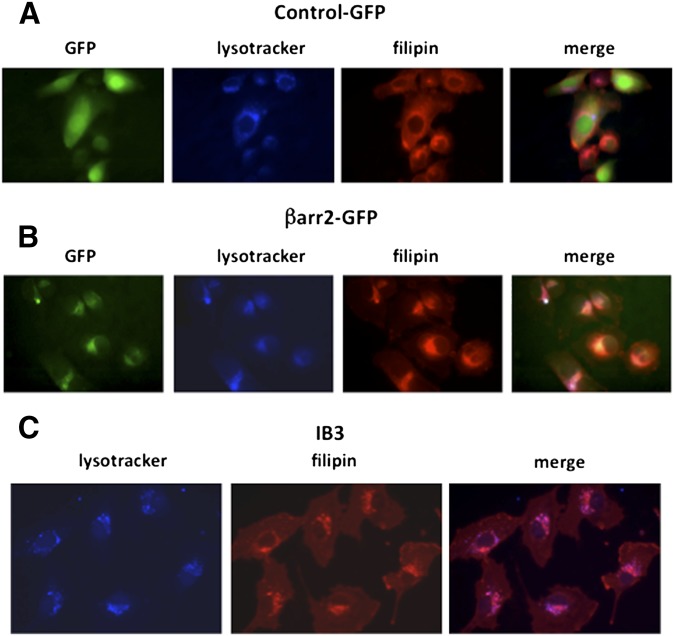
Fig. 3.
Localization of cholesterol and βarr2 in the lysosomes in CF and βarr2-overexpressing cells. (A) Representative image of lysosomes (LysoTracker) and endogenous free cholesterol (filipin) in GFP-expressing control cells. (B) Representative image of lysosomes (LysoTracker) and endogenous free cholesterol (filipin) in βarr2-GFP cells. (C) Representative image of lysosomes (LysoTracker) and endogenous free cholesterol (filipin) in IB3 cells. Images are representative of at least 15 images for each condition taken over three separate experiments.

