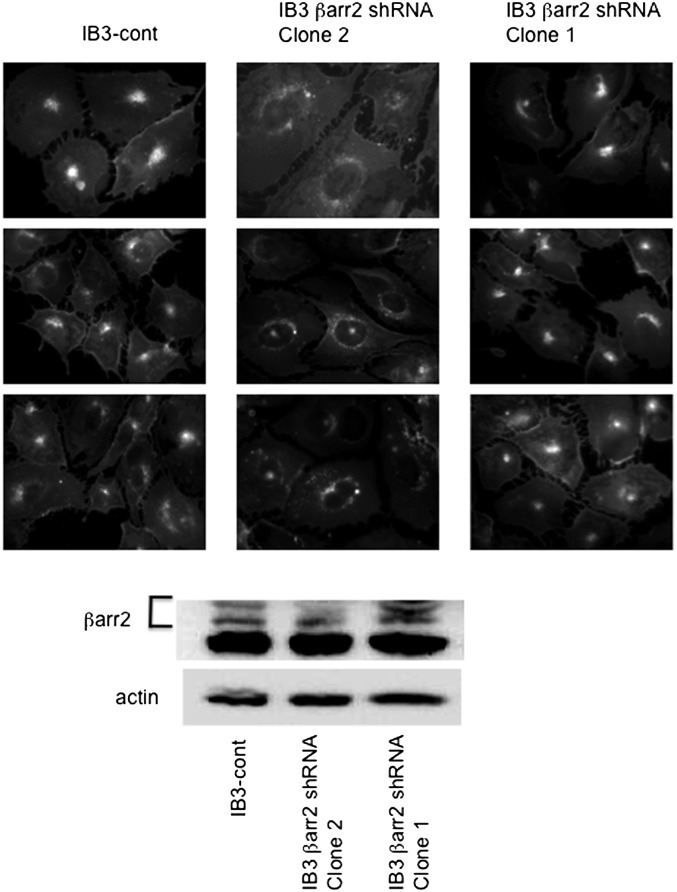
Fig. 4.
Correction of cholesterol accumulation in IB3 cells using βarr2 shRNA. (A) Three representative images from three clonal cell lines [IB3-control shRNA, IB3-βarr2 shRNA (clone 2), and IB3-βarr2 shRNA (clone 1)]. Only clone 2 (βarr2 shRNA) depleted βarr2 expression. Images show endogenous free cholesterol distribution using filipin staining. Images are representative of at least 15 images for each condition taken over three separate experiments. (B) Representative Western blot image showing βarr2 expression. Image is representative of three separate experiments.

